My conversations with Chris Verrone, Adrian Zduńczyk, and Mary Ellen McGonagle this week on The Final Bar left me striving to simplify my analysis of the S&P 500.
It's been a confusing time for stocks and as a result, my main daily chart of the S&P 500 has become much busier. I have found that, the more I'm drawing lines on a chart, the less clear the direction of the trend.
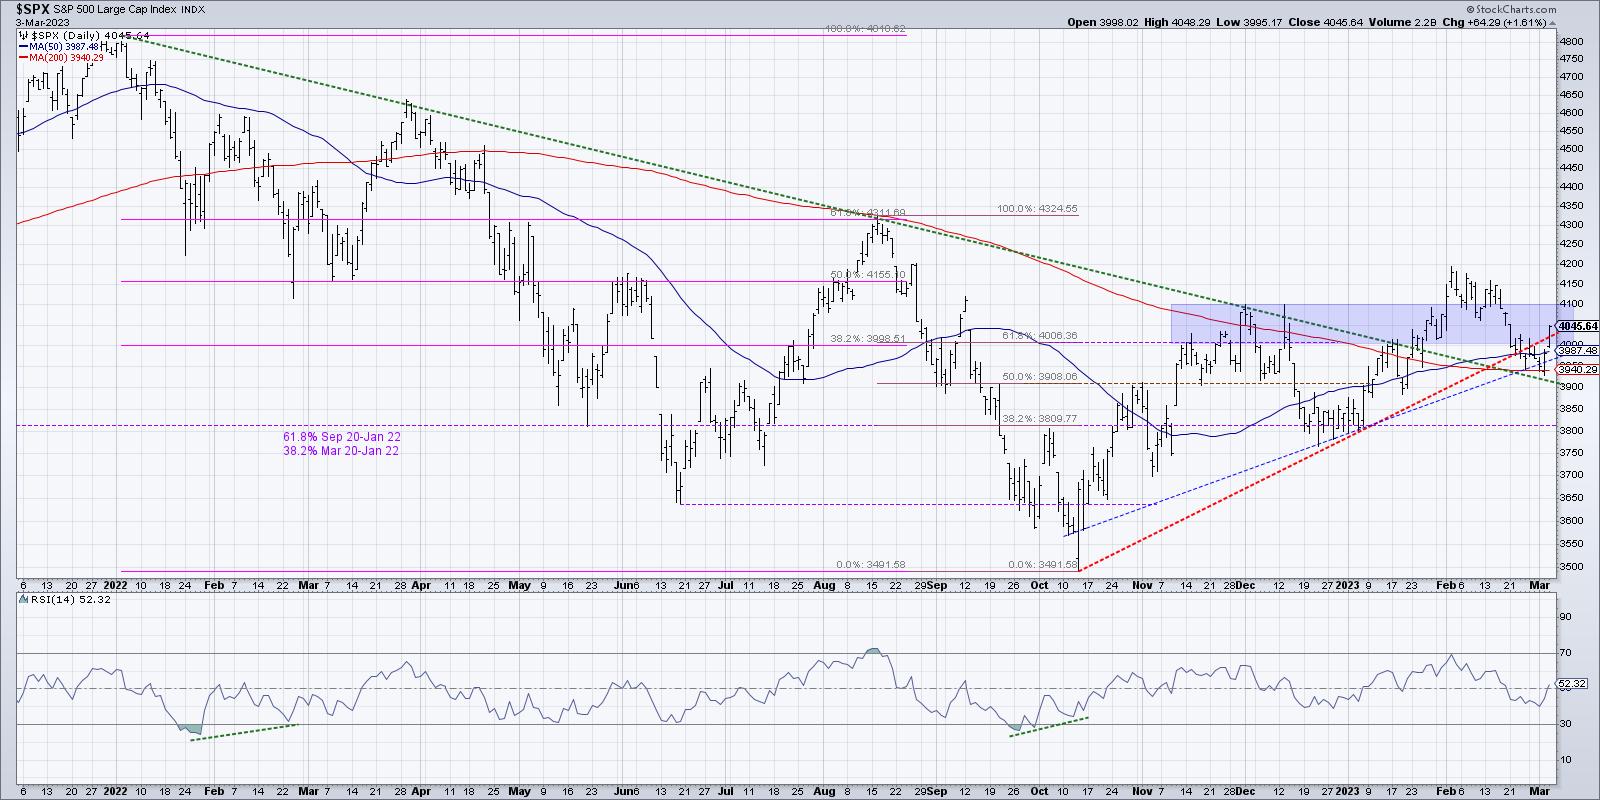
I stand by the value of everything shown on that chart, but I definitely would say that it would be helpful to take a fresh look with much less complexity! So in an effort to simplify, I have started fresh with a close-only chart of the S&P, along with the 200-day moving averages.
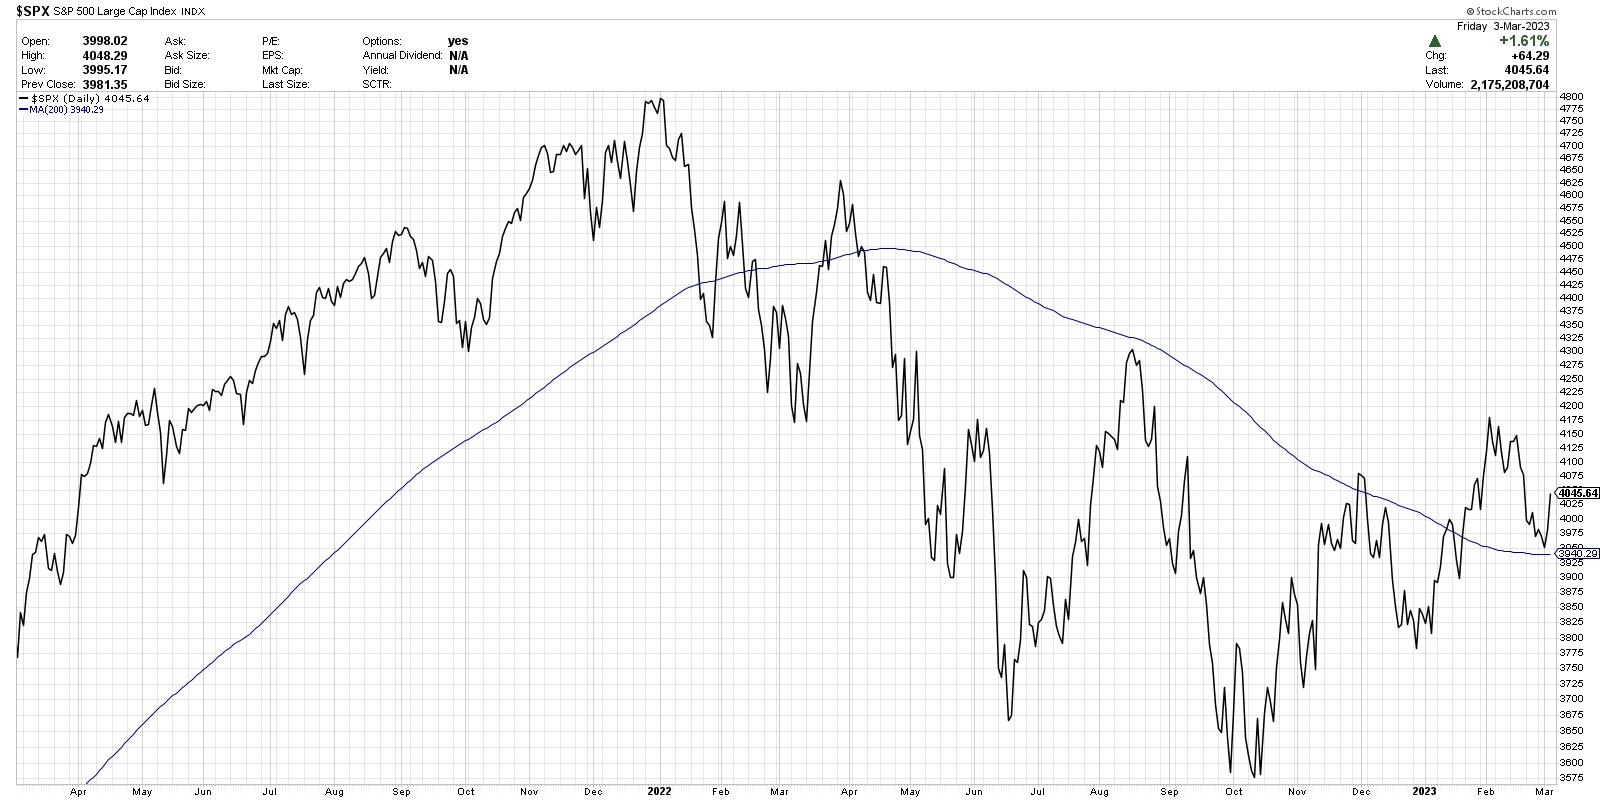
First off, this is way less busy. And in many ways, it's provides a much clearer illustration of the bull case for stocks. It also shows what would make that bull case no longer valid.
When we break down the S&P 500 chart to its simplest form, we see a clear transition from the bull phase of 2021 to the bear phase of 2022. And what tells us that the transition occurred? We had a clear lower high in March 2022 after the peak in January 2022. The SPX first broke the 200-day moving average in January, but then finally continued lower in April. And, by early May, we could clearly see the slope of the 200-day moving average had rotated from positive to negative.
Now focus on the last three months, when the SPX basically experienced the complete opposite set of conditions. We made a higher low in December after the new 52-week low in October. The S&P finally pushed above the 200-day moving average in January, and we can now see that the 200-day moving average has flattened out.
Here's another chart which includes trendlines to better define the bullish and bearish phases.
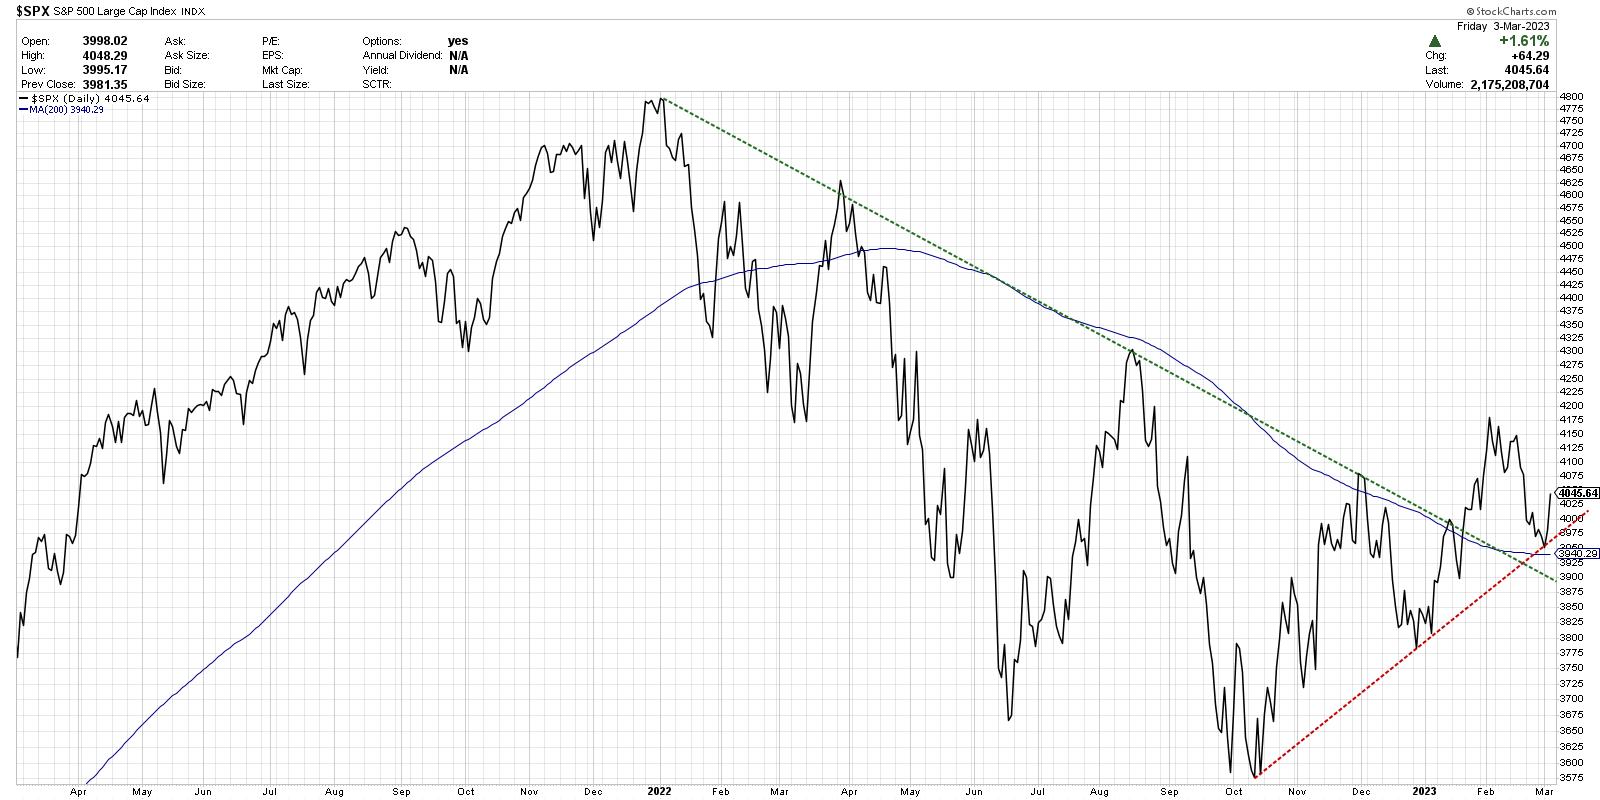
What does the bull case for stocks look like from a technical perspective?
We would see higher highs and higher lows, along with an upward-sloping 200-day moving average. And as the market would move onward and ever upward, we'd look for a return of the bearish pattern we saw in early 2022. Just as the bearish trendline was so valuable in confirming of the 2022 bearish market phase, the trendline connecting recent lows could be the best way to determine when the upward move was exhausted.
Here's the kicker. What would we need to see in the next week or two to suggest that the bull case was not engaged? I would say that a break below the 200-day moving average, along with a break below trendline support, would convince me to turn quite defensive. And that means that, for now, SPX 3940 is the level that needs to hold!
Before you go, check out my latest video, which shows why momentum investing tells you to search for strength in stocks!
RR#6,
Dave
P.S. Ready to upgrade your investment process? Check out my free behavioral investing course!
David Keller, CMT
Chief Market Strategist
StockCharts.com
Disclaimer: This blog is for educational purposes only and should not be construed as financial advice. The ideas and strategies should never be used without first assessing your own personal and financial situation, or without consulting a financial professional.
The author does not have a position in mentioned securities at the time of publication. Any opinions expressed herein are solely those of the author and do not in any way represent the views or opinions of any other person or entity.


