One of my early mentors often remarked, "Nothing good happens below the 200-day."This was his way of recognizing that, while stocks can certainly pop higher from beaten down levels, you're more likely to experience sustained advances once the price is above the 200-day moving average.
His remarks reminded me of successful chartists like Tom Dorsey relating point and figure charts to football. Can you score a touchdown when the defense is on the field? Sure. But it's way easier to score a touchdown when your offense has the ball!
So what does it mean that the S&P 500 index is once again testing its own 200-day moving average?
The Precarious Position for the SPX
When the S&P 500 broke above its 200-day moving average in January, this represented a significant improvement after the bear market phase in 2022. Instead of failing at this long-term barometer as it had in August and December, the benchmark had finally shown enough positive momentum to break above this important level. Soon after, the S&P also followed through above a trendline using the 2022 highs, again confirming the strength of buying power as the index made another new swing high.
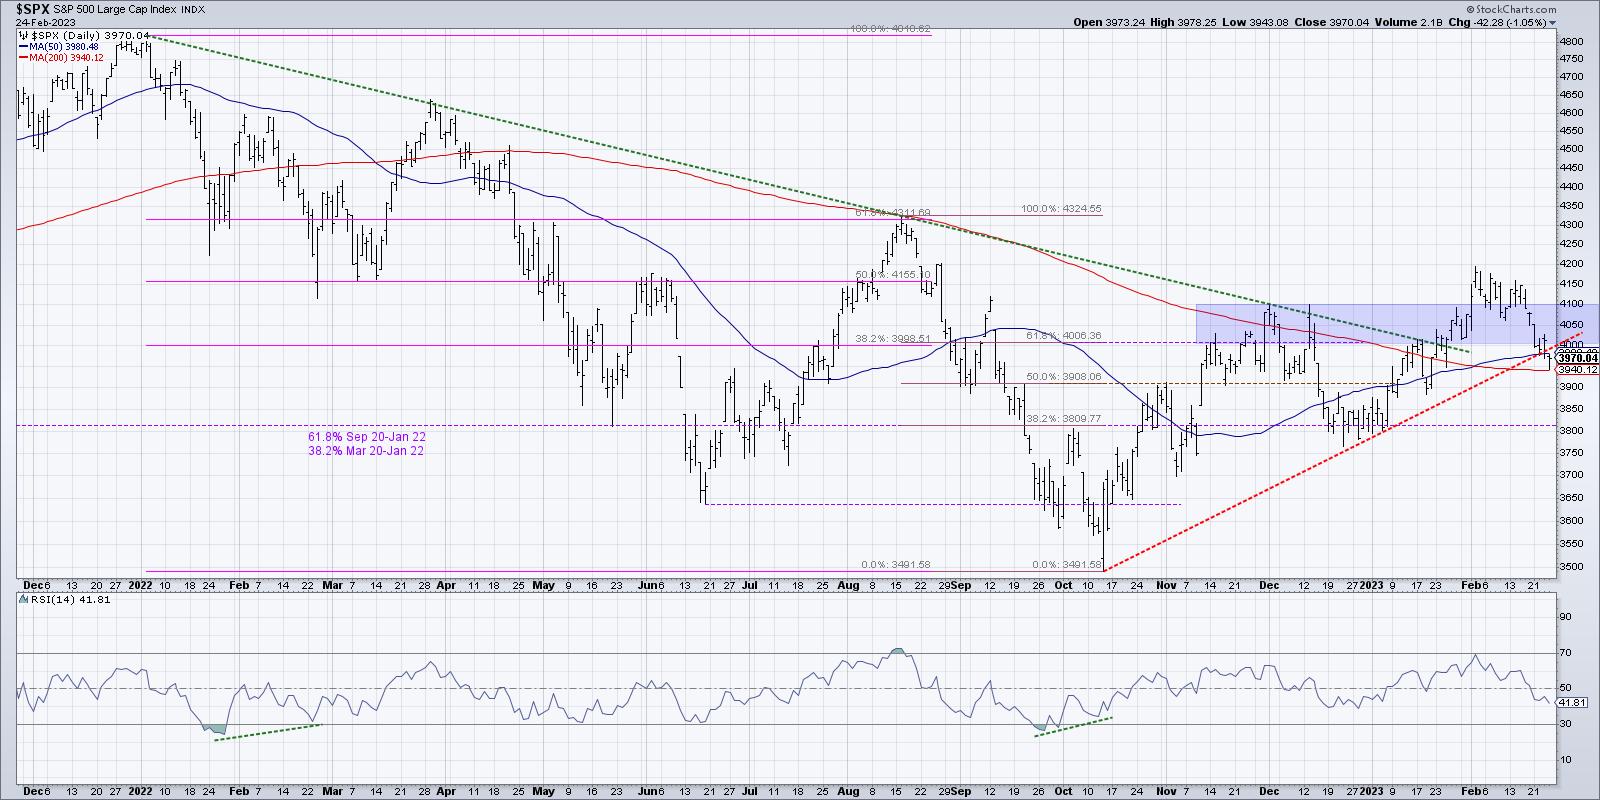
After finally pushing above the 4100 level in early February, the SPX stalled out just below 4200, before pushing back down into the blue-shaded area on our chart (4000-4100). As of Friday's close, the S&P 500 had broken below 4000, which puts it once again below this "congestion area" we've been focusing on since November.
Friday's drop also put the SPX below its 50-day moving average for the first time since mid-January, and below a trendline using the October and December lows. Now this key benchmark is at the "last line of defense," the 200-day moving average.
As the S&P tests this important support level, it's worth noting that the RSI remains just above 40. In bullish phases, the RSI usually bottoms out around 40 during pullbacks. So the bullish thesis for stocks would most likely need the RSI to remain at or above current levels while the SPX holds the 200-day moving average.
Confirming the Breakdown in Key Stocks
While the S&P 500 is testing its own 200-day moving average, a number of stocks have already broken down through their own 200-day. Let's review some of the most important benchmark names, Apple and Microsoft.
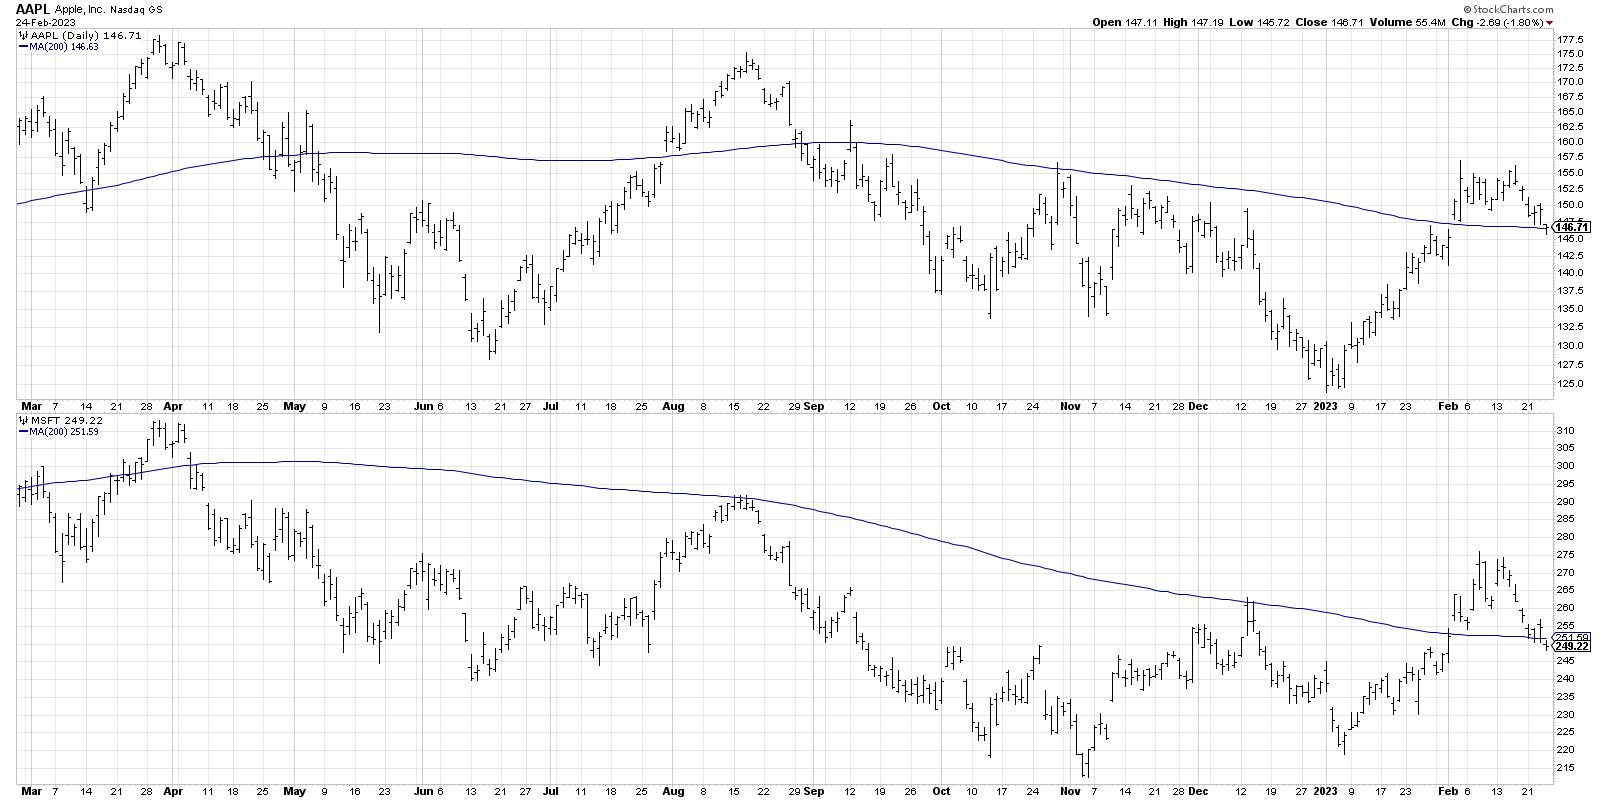
The FAANG stocks struggled in a big way during this shortened holiday week (full disclosure: I currently hold the triple short FANG & Innovation ETN, ticker BERZ), with NFLX turning in a disappointing -8.9% move since last Friday's close. It's hard to imagine our growth-dominated benchmarks thriving while these key mega cap names are struggling, and that's exactly what we have experienced so far in February.
AAPL finished the week at its 200-day moving average, while MSFT pushed below its 200-day on Friday. So while both names managed to gap above this long-term barometer at the beginning of February, this last week showed a major short-term reversal, as both stocks made a new low for the month.
How bullish do we want to be if both Apple and Microsoft are failing to hold above their 200-day moving average? Not very.
And It's Not Just AAPL and MSFT
Home Depot (HD) came up in a number of conversations this week, including my interviews with Danielle Shay and Dave Landry. We all noted the gap lower this week after Tuesday's earnings call, but the most negative evidence is the lack of buyers coming in as the price deteriorated into the end of the week.
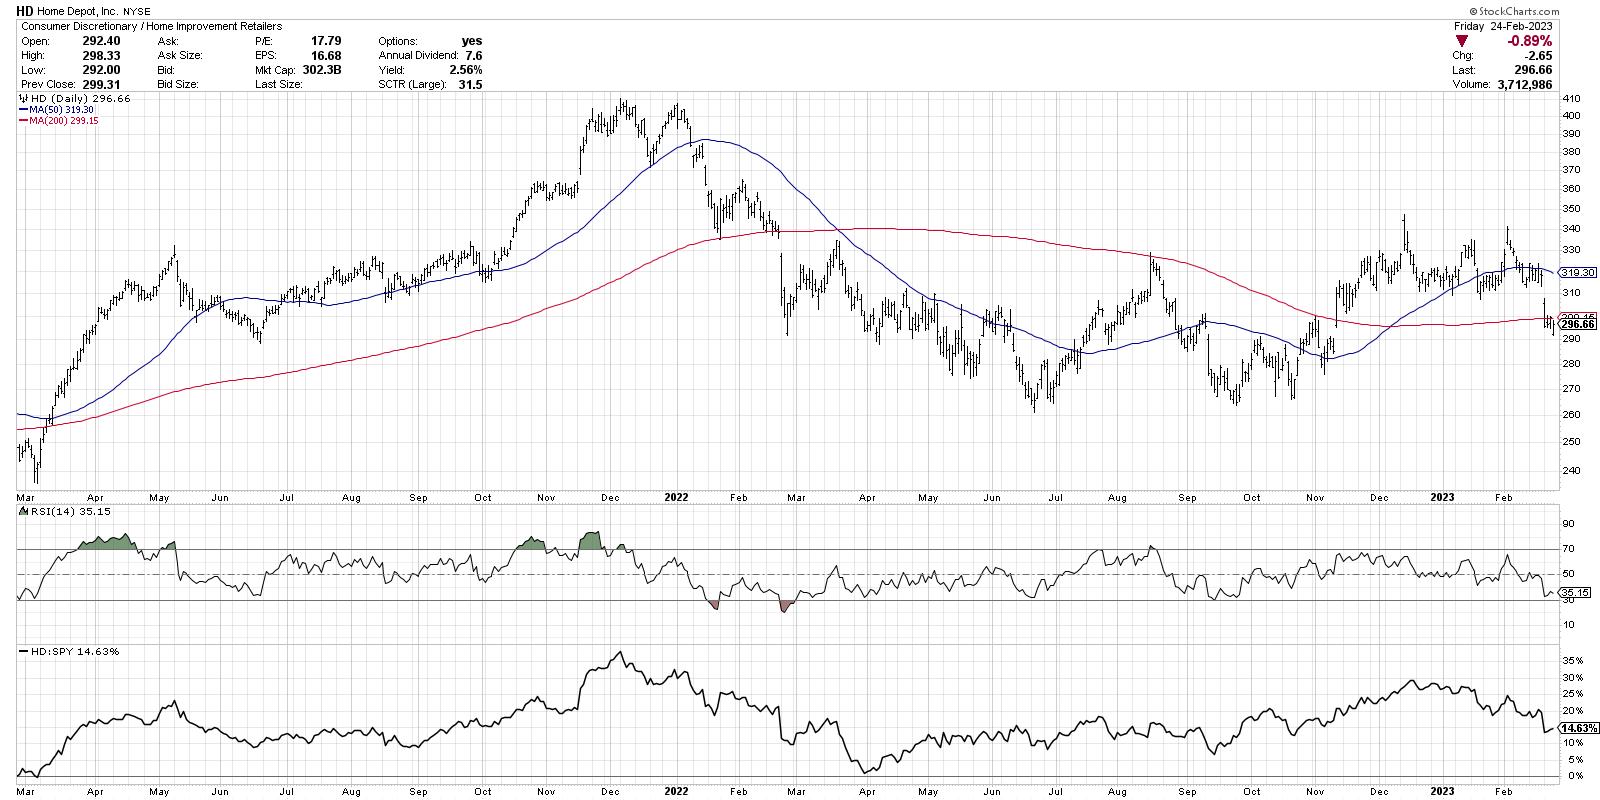
With the 310 support level now in the rearview mirror, as well as the important 200-day moving average, the question is where HD finds support given the bearish momentum characteristics. My concern is that there isn't much from a technical perspective in terms of support until you get down to the 2022 lows around $265. That's another 10% below Friday's close.
Even broader measures of moving average support indicate that stocks are struggling to remain above their own 200-day. A number of our five favorite breadth indicators have given bearish signals in February, suggesting that the rally off the October lows was at least ready for a pullback, if not a deeper retracement of previous gains.
While a handful of groups (heavy construction, semiconductors come to mind) remain on solid footing, I'm concerned by the fact that some of the most important charts to watch are now at or below their 200-day moving average.
And nothing good happens below the 200-day.
Oh and one more thing...
Interested in my latest take on ARKK and a potential bullish pennant formation? Head over to my YouTube channel!
RR#6,
Dave
P.S. Ready to upgrade your investment process? Check out my free behavioral investing course!
David Keller, CMT
Chief Market Strategist
StockCharts.com
Disclaimer: This blog is for educational purposes only and should not be construed as financial advice. The ideas and strategies should never be used without first assessing your own personal and financial situation, or without consulting a financial professional.
The author does not have a position in mentioned securities at the time of publication. Any opinions expressed herein are solely those of the author and do not in any way represent the views or opinions of any other person or entity.


