A number of my conversations this week on The Final Bar dealt with the challenges presented by narrow leadership. Joe Rabil pointed out the weakness in small caps, and Jeff Huge focused on the difference between the YTD returns of FAANG stocks versus pretty much everything else.
Why is narrow leadership such a problem?
In the end, it's all about broad participation, and whether the "infantry" (mid-cap and small-cap stocks) are following the "generals" (mega-cap and large-cap names). In healthy bull market phases, the average stock tends to do pretty well because "a rising tide lifts all boats."
We shared a video earlier this week outlining the issues with narrow market leadership and what we'd need to see to turn more bullish on prospects for risk assets. Today, we'll look at the five FAANG stocks one-by-one, focusing on key levels to watch that would indicate a potential new leg lower for our major benchmarks.
The Strong: META and AAPL
When I look at the five stocks in question, I'm immediately drawn to the two with the most encouraging trends in 2023.
To start, META has more than doubled since its low in November and made a new high for the year again this week.
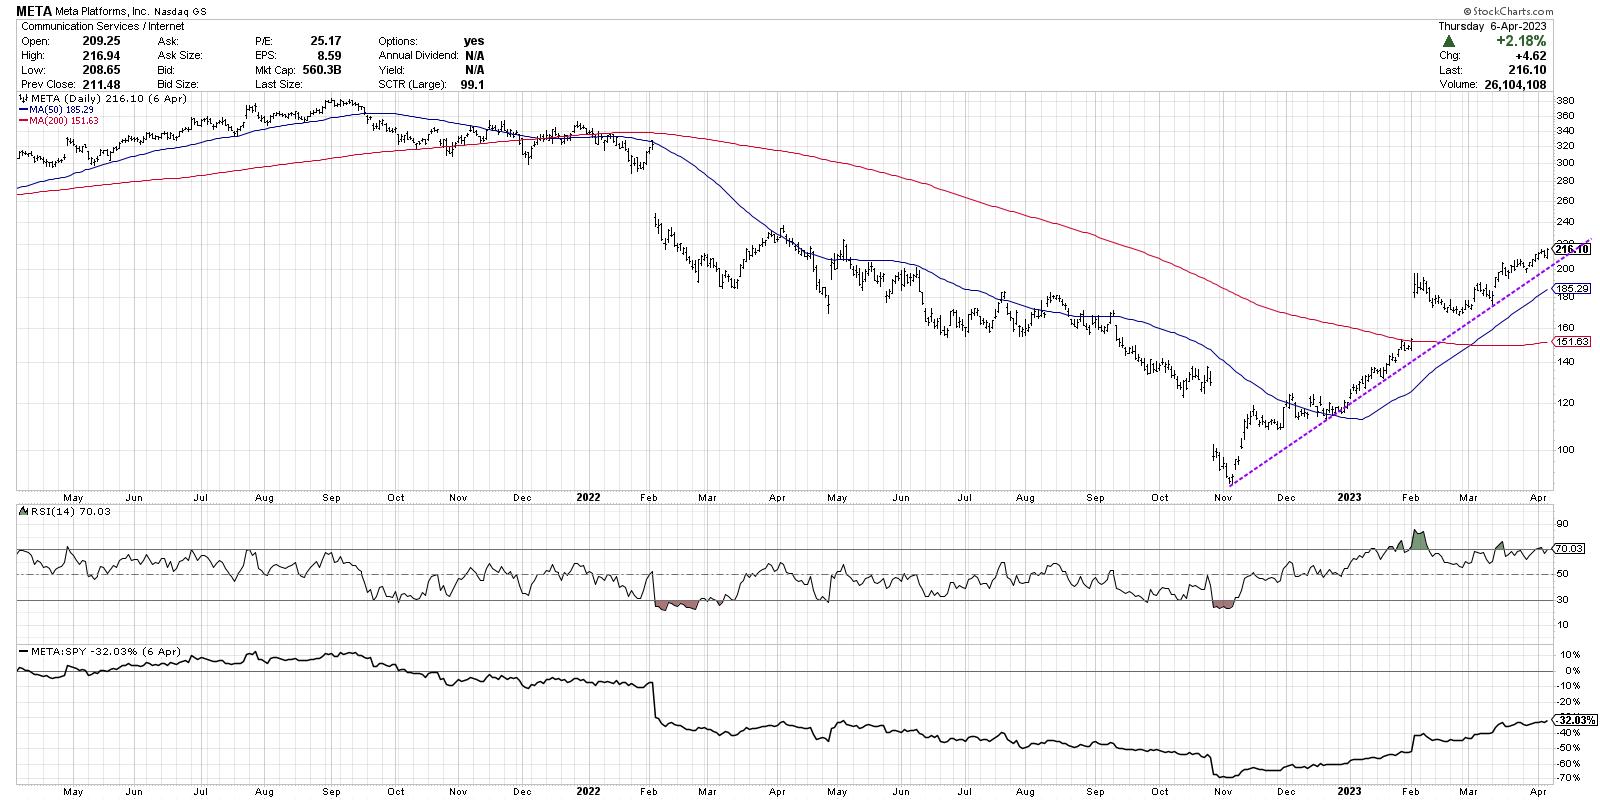
If you draw a trendline starting at the November low, you'll see that the pace of this uptrend has been remarkably consistent. The stock remains above two upward-sloping moving averages, and the recent breakout above $200 was just the latest in a series of confirmational up moves.
Ready to upgrade your investment process, improve your understanding of market dynamics, and make real progress on your journey of behavioral investing? Check out our Market Misbehavior premium membership!
A chart like this provides a fairly straightforward game plan, in my opinion, because as long as the price remains above this trendline, the uptrend is intact. If and when the purple trendline is broken, that will tell us of a potential "change of character" on the chart.
There's a similar look to the chart of Apple (AAPL), although in this case the ultimate low was right at the beginning of 2023.
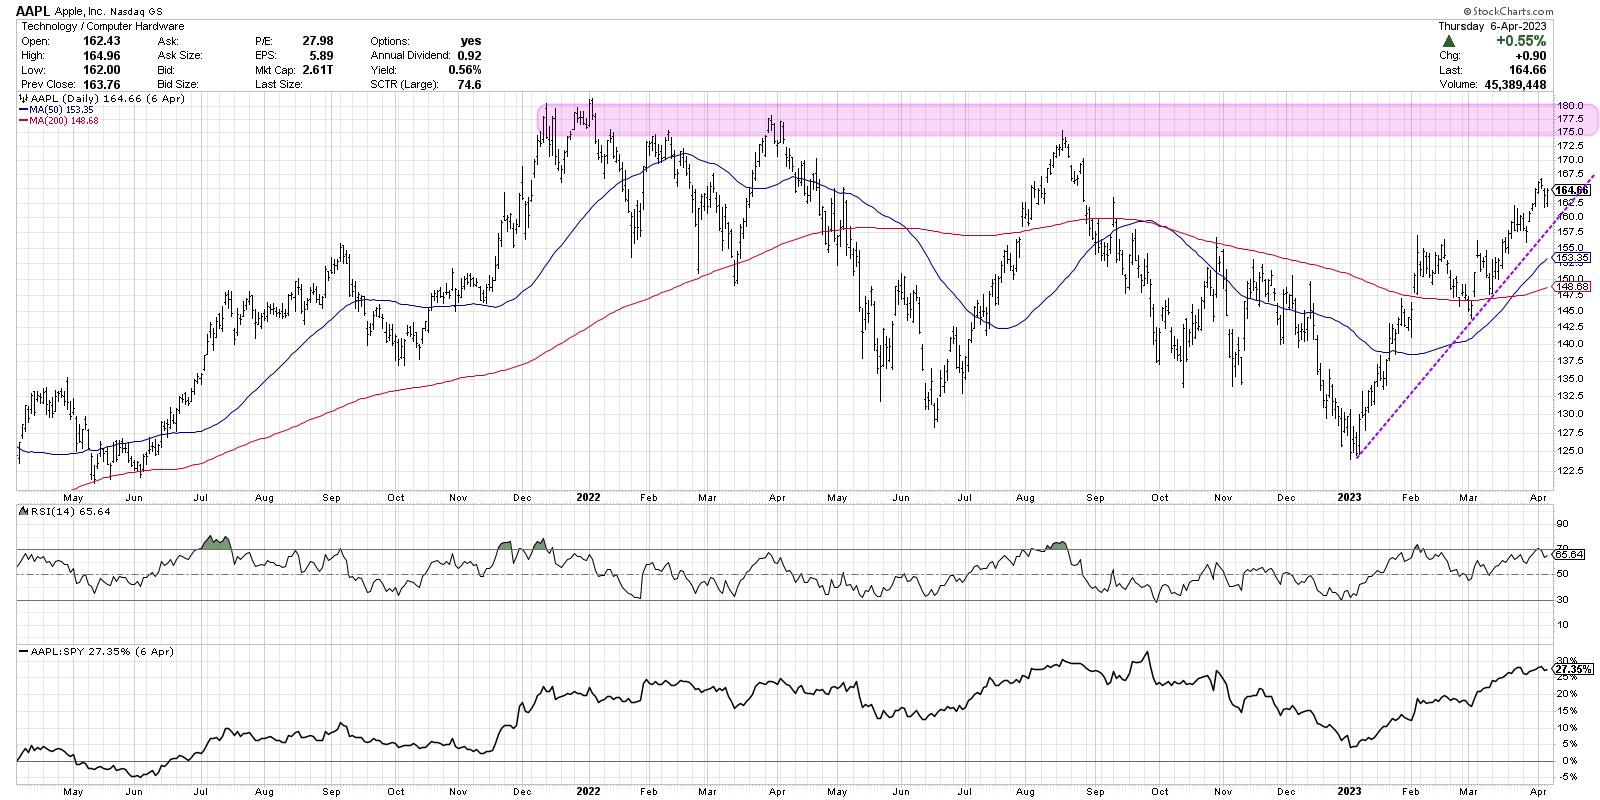
Here, we can see the trendline connecting the recent lows show a consistent uptrend as well, which can provide a very clear sell signal when that trendline is breached.
The problem with the AAPL chart is that it is approaching a significant resistance level in the $175-180 range. This level was where the stock first topped out in December 2021, and subsequent highs in Jan 2022, Feb 2022, Mar 2022. and Aug 2022 were around that same level.
If Apple is able trade not just to resistance but through it, pushing above the key $180 level, then that would be an incredibly strong argument for a continued bullish phase for our major equity benchmarks. However, the fact that this level has been tested numerous times already tells me to be wary as AAPL attempts to breakout yet again.
The Questionable: GOOGL & NFLX
In terms of actionable signals this week, Alphabet (GOOGL) finished the week above its February high around $108. If we see further follow-through after the holiday weekend, that could indicate another bullish sign for our equity indexes.

I'll label this chart as "questionable," because I would argue there is still much to prove here. Note how the February high was an unsuccessful attempt to break above the 200-day moving average. In March, the price finally broke above the 200-day, then retested this moving average from above.
So, just below current levels, we have a confluence of support, based on the 200-day moving average, the most recent swing low in late March, and a "big round number" of $100 which often serves as support. If and when GOOGL breaks below $100, that would raise a serious red flag given the lack of upside follow-through.
Netflix (NFLX) has a fairly constructive chart, given that it's currently above its 200-day moving average, but is at the risk confirming a lower high, as it pulled back in the latter half of this week.

NFLX has one of the strongest runs of performance from May 2022 to Feb 2023, but, unfortunately, the stock sort of stalled out in February and March. The high this week was around $350, well below the February peak at $375.
One of two things will happen on this chart once the current consolidation phase is complete. A break to a new swing high around $375 would confirm a new bullish phase for this stock. On the other hand, if NFLX breaks below its March low around $280, followed by a break below the 200-day moving average, that would provide a key bearish signal in a crucial mega cap stock.
The Ugly: AMZN
Now we come to what I would consider to be the clearly weakest chart of the five. Why can I say that with confidence? Because it's the only one of the five currently below its 200-day moving average.
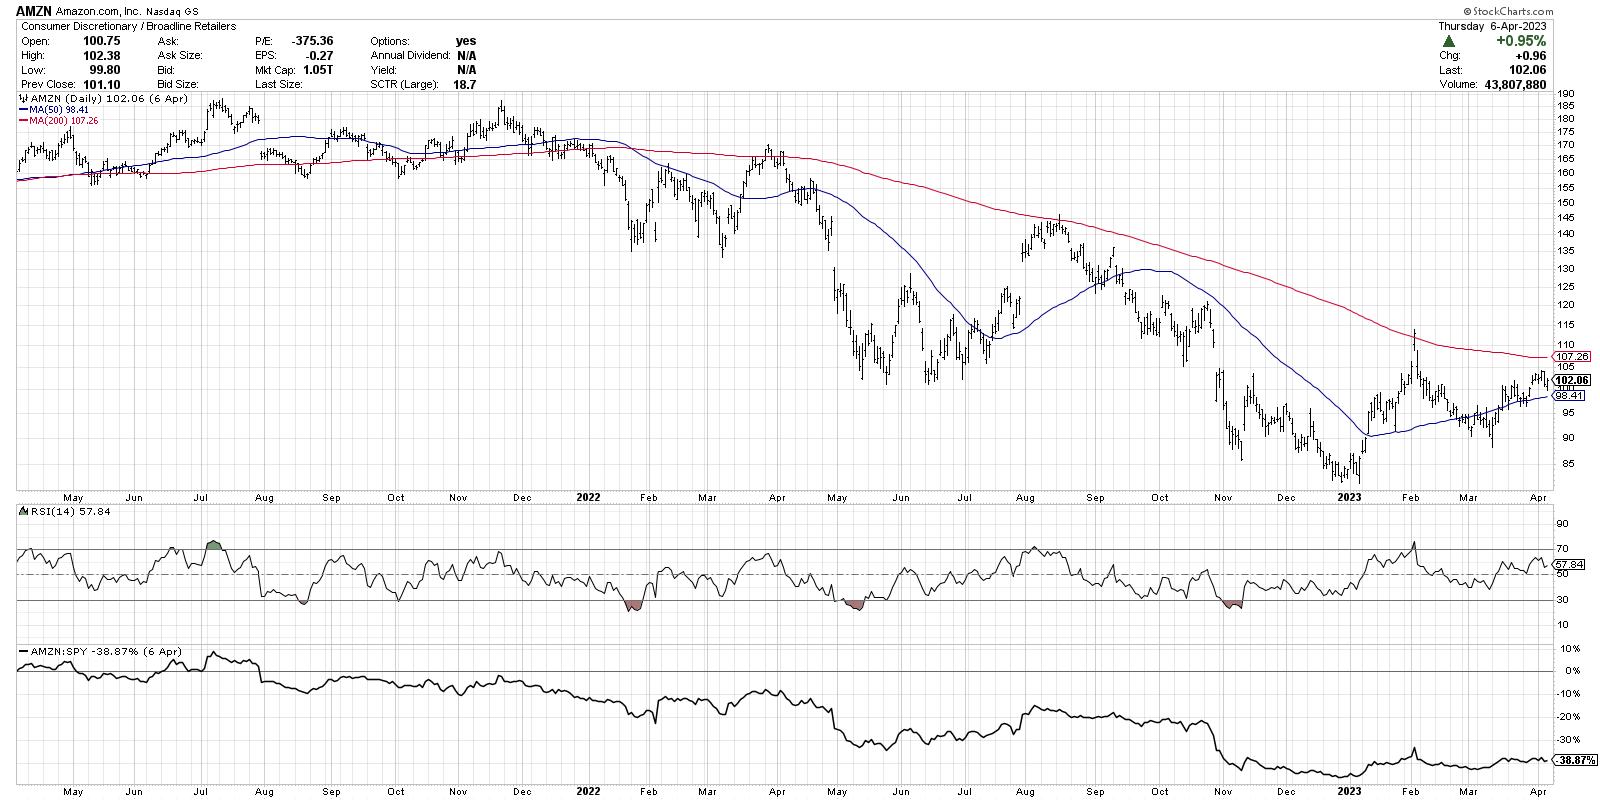
Look at how many times AMZN has attempted to break back above its 200-day after first breaking down in January 2022. The February rally was just the latest attempt to push above this classic long-term trend barometer.
The bullish case for Amazon would be based on the higher low in March around $90. But what would actually turn this chart from bearish to bullish? I would argue that, until AMZN can power above the February high, which would take the stock well above its own 200-day moving average, the primary trend remains down.
The most important charts I analyze every day are the weekly and daily charts of the S&P 500 index. After that, I look at literally hundreds of individual stock charts every single day. By focusing on the key levels of interest on these five charts, you'll be monitoring the most important stocks with the greatest ability to have meaningful impact on the broader equity indexes.
Want to go through these charts through an immersive video experience? Just head over to my YouTube channel!
RR#6,
Dave
P.S. Ready to upgrade your investment process? Check out my free behavioral investing course!
David Keller, CMT
Chief Market Strategist
StockCharts.com
Disclaimer: This blog is for educational purposes only and should not be construed as financial advice. The ideas and strategies should never be used without first assessing your own personal and financial situation, or without consulting a financial professional.
The author does not have a position in mentioned securities at the time of publication. Any opinions expressed herein are solely those of the author and do not in any way represent the views or opinions of any other person or entity.


