A number of my recent conversations on The Final Bar have related to the conflict presented in the markets in April 2023. Classic measures of market trend, from the Coppock Curve to the Zweig Breadth Thrust to my own Market Trend Model, are all giving a strong positive signal on trend strength. But a deeper dive into the conditions for small-caps or defensive sectors or recessionary periods suggest that the equity indexes are basically pricing in an irrational and unlikely recovery, despite clearly negative conditions.
In my opinion, a technical indicator signal is not a single moment, but rather involves three particular steps. In our upcoming FREE webcast, "Three Steps to Every Signal," we'll break down the setup, the trigger and the confirmation using recent examples. Don't miss this opportunity to upgrade your use of technical analysis to better identify profitable opportunities! Sign up HERE.
So who's right?
Today, we'll break down five measures of market conditions, many of which suggest further caution at this point, despite the seasonal strength that usually plays out in the month of April.
The Market Trend Is Most Important
The first data series on today's chart is undoubtedly the most important, and that is the price of the S&P 500 index. I was told early on from mentors like Ralph Acampora to focus first on the trend in the S&P 500. Everything else comes after that!
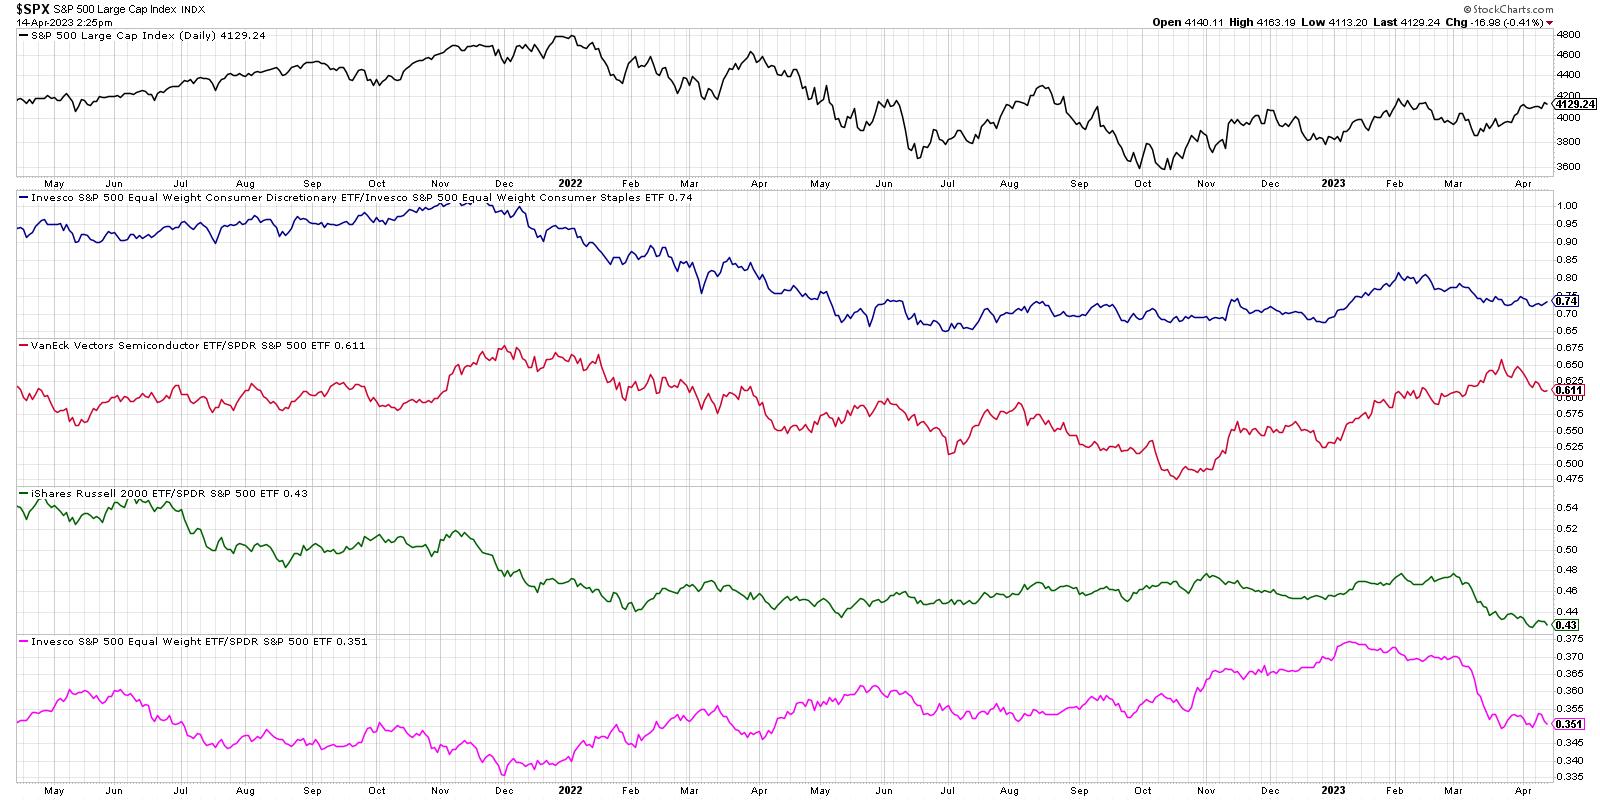
The top panel in the chart is the closing price of the S&P 500, which arguably aggregates all of the uncertainty I outlined above. I believe the SPX is a good illustration of the sentiment of equity investors, but I also recognize that a small number of mega-cap stocks have an outsized impact on the performance of this particular index.
The S&P 500 finished the week above 4100, which means we are once again testing the November 2022 and February 2023 highs. Will the SPX have enough upside momentum this time around to power through to a new swing high? The answer may be yes, but that answer is certainly not clear today.
Defensive Sectors Are Leading
I was asked recently about which sectors tend to do well during recessionary periods. I answered that three sectors tend to perform the best in this sort of environment: Consumer Staples, Utilities, and Health Care. Of course, these are all fairly defensive sectors, and represent products and services that you would most likely still spend money on regardless of market conditions and your own financial state.
The ratio of offense vs. defense in the consumer space (second panel down) has clearly been favoring Consumer Staples since the February market peak. So even as the market has rallied in recent weeks, defense is still outperforming offense.
Semiconductors have been one of the strongest groups off the October 2022 market low, and while the relative strength of the SMH is still in an uptrend, we're seeing a bit of a pullback in recent weeks. This may be an important chart to watch for a downside reversal, particularly using trendline support.
Smaller Stocks Are Still Struggling
The most concerning data series on this chart are the final two, which track the relative performance of the small-cap Russell 2000 ETF and relative performance of the equal-weight S&P 500 ETF. Both of these ratios have been moving lower over the last eight to ten weeks, indicating the underfperformance of small- and mid-cap stocks vs. large- and mega-cap names.
Why is this an important measure of market risk?
When institutional investors are ready to take on more risk in their portfolio, they tend to look for higher beta, higher risk, and more speculative companies. The small-cap and mid-cap space is filled with emerging growth stories with long-term growth potential. So when these stocks are performing well, it suggests that investors are ready to take on more risk. That does not appear to be the case recently, where investors are instead favoring more established and less risky stocks like AAPL, MSFT, and others!
Can the market go higher from here? Absolutely. And given the lower volatility with the SPX poking above 4100, there is a very real possibility that we see an upside follow-through. But to feel more confident on potential for further upside, I'd want to see confirmation from some of the indicators presented in the chart above.
Want to digest this article in video format? Head on over to my YouTube channel!
RR#6,
Dave
P.S. Ready to upgrade your investment process? Check out my free behavioral investing course!
David Keller, CMT
Chief Market Strategist
StockCharts.com
Disclaimer: This blog is for educational purposes only and should not be construed as financial advice. The ideas and strategies should never be used without first assessing your own personal and financial situation, or without consulting a financial professional.
The author does not have a position in mentioned securities at the time of publication. Any opinions expressed herein are solely those of the author and do not in any way represent the views or opinions of any other person or entity.


