Earlier this week, I completed a "clean slate" exercise on the S&P 500 chart.
You see, my charts become pretty busy over time, because I draw lots of trend lines and put notes on the charts as well. Basically, I consider charts to be the way you have a conversation with the markets! And after a while, the conversation gets a little muddy, and you need to reset.
My normal S&P 500 chart looks like this:
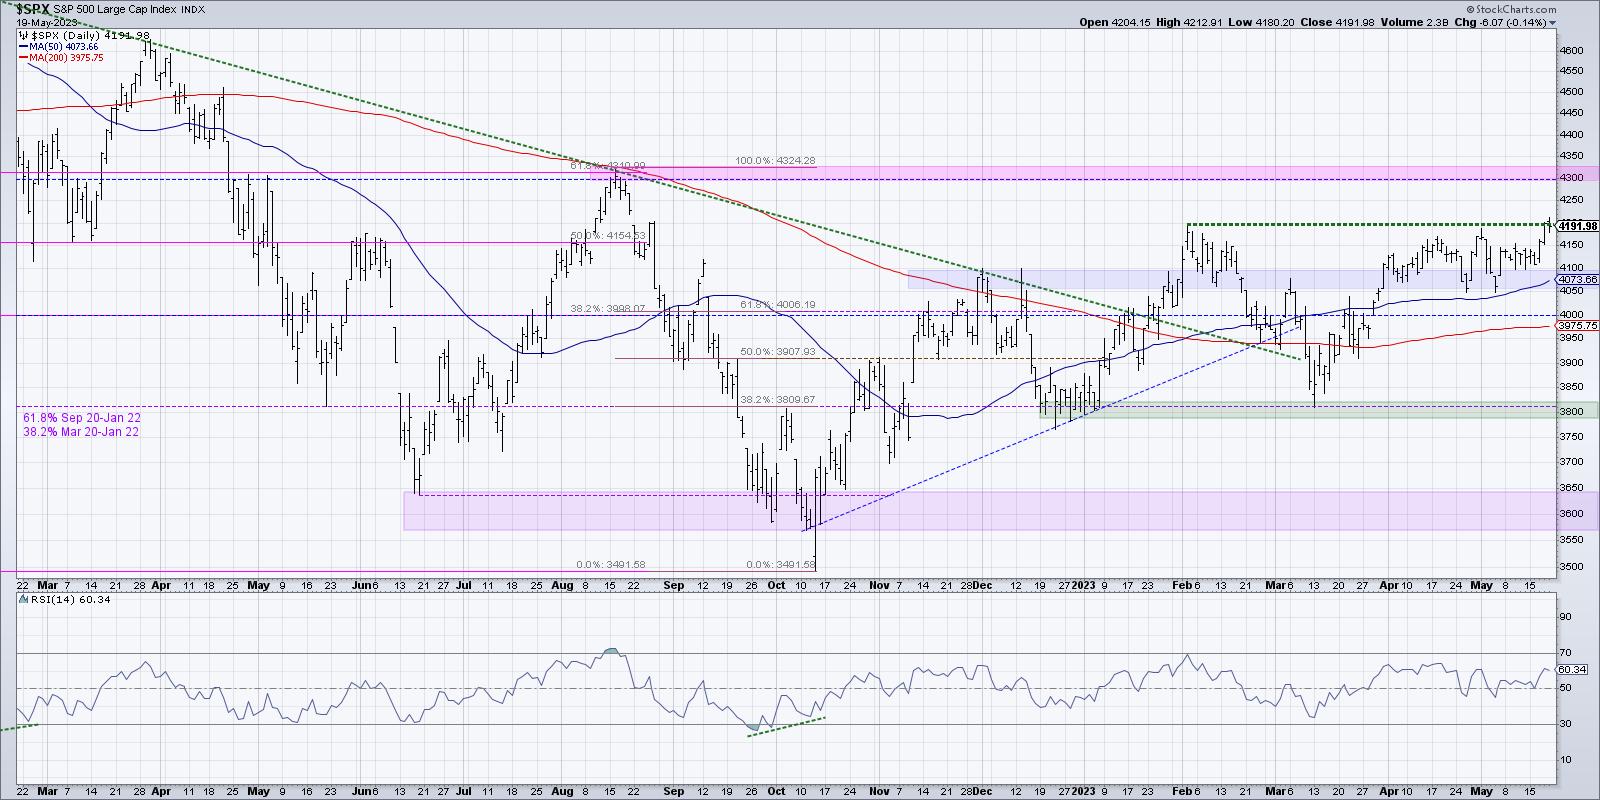
Viewers of The Final Bar on StockCharts TV will probably be very familiar with this daily SPX chart, because we review it on pretty much every episode of the show!
Every line drawn on that chart comes from some moment where, in reviewing the chart, I felt that I needed to indicate a particular level or trend or pattern. Over time, the chart can accumulate quite a bit of noise!
Should we "sell in May and go away" in 2023? Join me for a free webcast on Tuesday May 23rd at 1:00pm ET called Sell In May: Trends vs. Cycles. We'll review the history of this seasonal pattern, compare the current market environment to past cycles, and decide together whether we should indeed "sell in May!" Sign up HERE for this free event!
So I saved a new version of this chart and went with a completely clean slate. Okay, I did add back the moving averages and RSI, but other than that it's pretty clean!
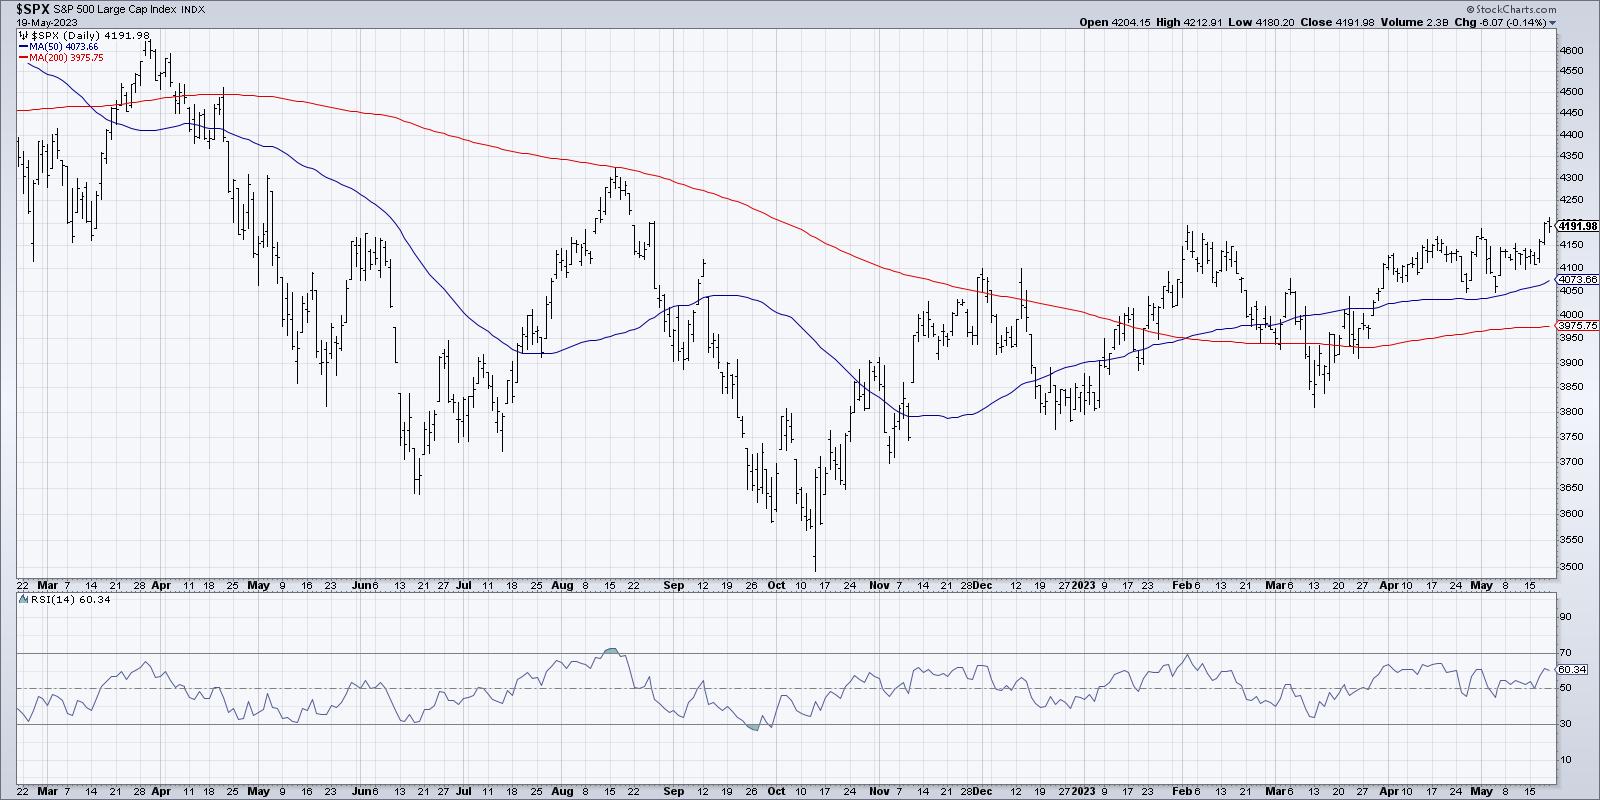
What jumps out at you as you're looking and reflecting on the price movements and price patterns? For me, I was immediately drawn to the higher lows from October to December to March. I drew that trendline first (dashed blue line), and it struck me that my first takeaway was the bullish pattern of higher lows over time.
Next, I noticed how we were approaching the February high around 4200, so I drew a dashed pink line to indicate this important resistance level. It turns out Thursday's close was almost exactly at this level, and then Friday's drop pulled right back below 4200.
Finally, I noticed the symmetry around the 4100 level. The S&P 500 hit 4100 in early December of last year, and I would argue that February's run to 4200 was essentially a failed attempt to break above that December high. We spent most of the last six weeks sitting right around 4100, so that trendline was added next.
I sat back and reviewed my trendline analysis, and realized that I was missing one of the most effective ways to identify potential support and resistance levels between two extreme prices: Fibonacci Retracements. When a market has established a significant high (SPX 4800 in January 2022) and then a significant low (SPX 3500 in October 2022), Fibonacci Retracements can help to anticipate where the market may retrace as the price attempts to push higher and regain the previous highs.
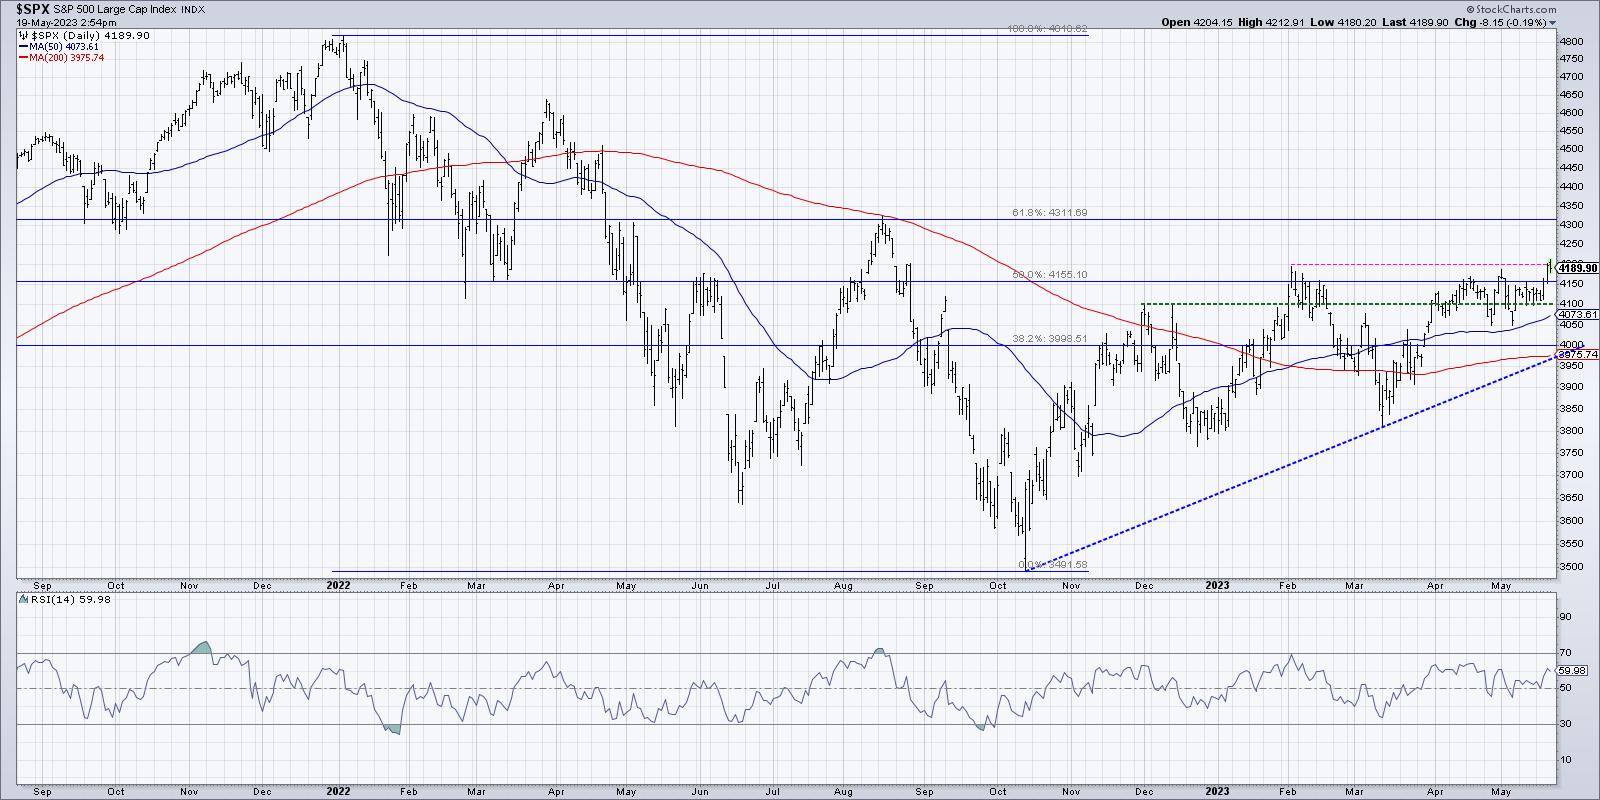
When I applied the Fibonacci ratios to the chart, I remembered why I was so focused on the 4000 level in the 4th quarter of last year. This represented a 38.2% retracement of the 2022 range and seemed to be a likely upside target on the initial rally off the October lows.
Sure enough, we hit 4000 in November and spent about four weeks chopping around that price point. When we finally saw a follow-through move above 4000 in January, that opened the way to the 50% level around 4155, which was reached in early February.
Just can't get enough Dave Keller in your life? My newsletter focuses on behavioral investing, combining the best practices of technical analysis and behavioral finance. Check it out!
For the last six weeks, we've been talking about the S&P 500 hitting 4200 and whether it can eclipse the February high. This chart now reminded me that the 50% Fibonacci level was also at play here, and getting above 4155 was an important milestone as well.
So if the SPX does indeed power above the February high next week (still very much an open question in my opinion!), what's the next upside objective?
A 61.8% retracement of the 2022 selloff would take the SPX to around 4310. That is pretty much exactly at the August 2022 high! Here, we have a "confluence of resistance" where traditional support and resistance analysis aligns with Fibonacci retracements. Based on the narrow leadership in 2023, and the anemic breadth conditions persisting through this week, I would expect a move above 4300 to be highly unlikely.
What if the S&P 500 index fails here and pushes back lower? Well, we have plenty of support levels and Fibonacci levels below the current price, including the 4150 and 4100 price points. I'm immediately drawn to 4000, which represents a "confluence of support" based on Fibonacci analysis, the 200-day moving average, and the trendline we mentioned at the beginning of this article.
There is plenty to be bullish about, with strong uptrends in many equities and our Market Trend Model remaining bullish on all three time frames. But, when markets are facing significant overhead resistance, I have to question the risk vs. reward at current levels.
Want to learn more about Fibonacci in a handy video format? Head over to my YouTube channel!
RR#6,
Dave
P.S. Ready to upgrade your investment process? Check out my free behavioral investing course!
David Keller, CMT
Chief Market Strategist
StockCharts.com
Disclaimer: This blog is for educational purposes only and should not be construed as financial advice. The ideas and strategies should never be used without first assessing your own personal and financial situation, or without consulting a financial professional.
The author does not have a position in mentioned securities at the time of publication. Any opinions expressed herein are solely those of the author and do not in any way represent the views or opinions of any other person or entity.


