TAKEAWAYS
- The major equity benchmarks have broken initial support levels, fueled by weakening momentum and declining breadth conditions.
- A break below trendline and moving average support could indicate a high likelihood of further potential downside.
- Seasonal studies suggest a strong 4th quarter, so look for a hold of the key S&P 4200 level to negate the bullish thesis.
We first saw the mega-cap technology names rotate lower, with Apple (AAPL) and Microsoft (MSFT) breaking down after clear bearish divergences. We now have almost all of the "Magnificent Seven" growth stocks breaking down through their 50-day moving averages, joining about 55% of the S&P 500 members in doing so.
Is this really the time to be bullish? Well, yes and no, depending on your time frame. My base case is for further downside in August into September, setting the benchmarks up for a nice rally in the fourth quarter. But the essence of what I call "probabilistic analysis," of which I'm a big proponent, is to force yourself to consider alternatives and think through various scenarios.
I feel that investors are sometimes caught on the wrong side of the markets not because of a lack of conviction, but a lack of imagination. If we can think through different potential scenarios now, then we should be much better prepared when something unusual happens next!
I'm super excited for our next free webcast, THE GREAT ROTATION OF 2023. We'll talk seasonal tendencies, sector rotation, breadth dynamics, and leadership shifts with all the charts. If you're struggling to keep up with leadership shifts and competing narratives, let us help you cut through noise and focus on the message of the markets.
We're going live on Tuesday, August 22nd at 1:00pm ET. Sign up for this free webcast right HERE!
This also gives me another chance to post something completely opposite to Tom "The Bull" Bowley, which is always a pleasure. To be clear, his article this week makes some excellent points on sentiment shifts suggesting optimism here. But let's get back to stretching our thinking with a bearish alternative or two.
Today, I'll briefly break down the current conditions in terms of price and breadth indicators. We'll then review some signals that could confirm further downside potential and what we'd need to see to turn away from a bearish thesis.
What are the Current Market Conditions?
When in doubt, follow the trend in the markets. And that trend is currently down. Well, it actually depends on your timeframe. Our Market Trend Model is bearish on the short-term, but still bullish on the medium-term and long-term.
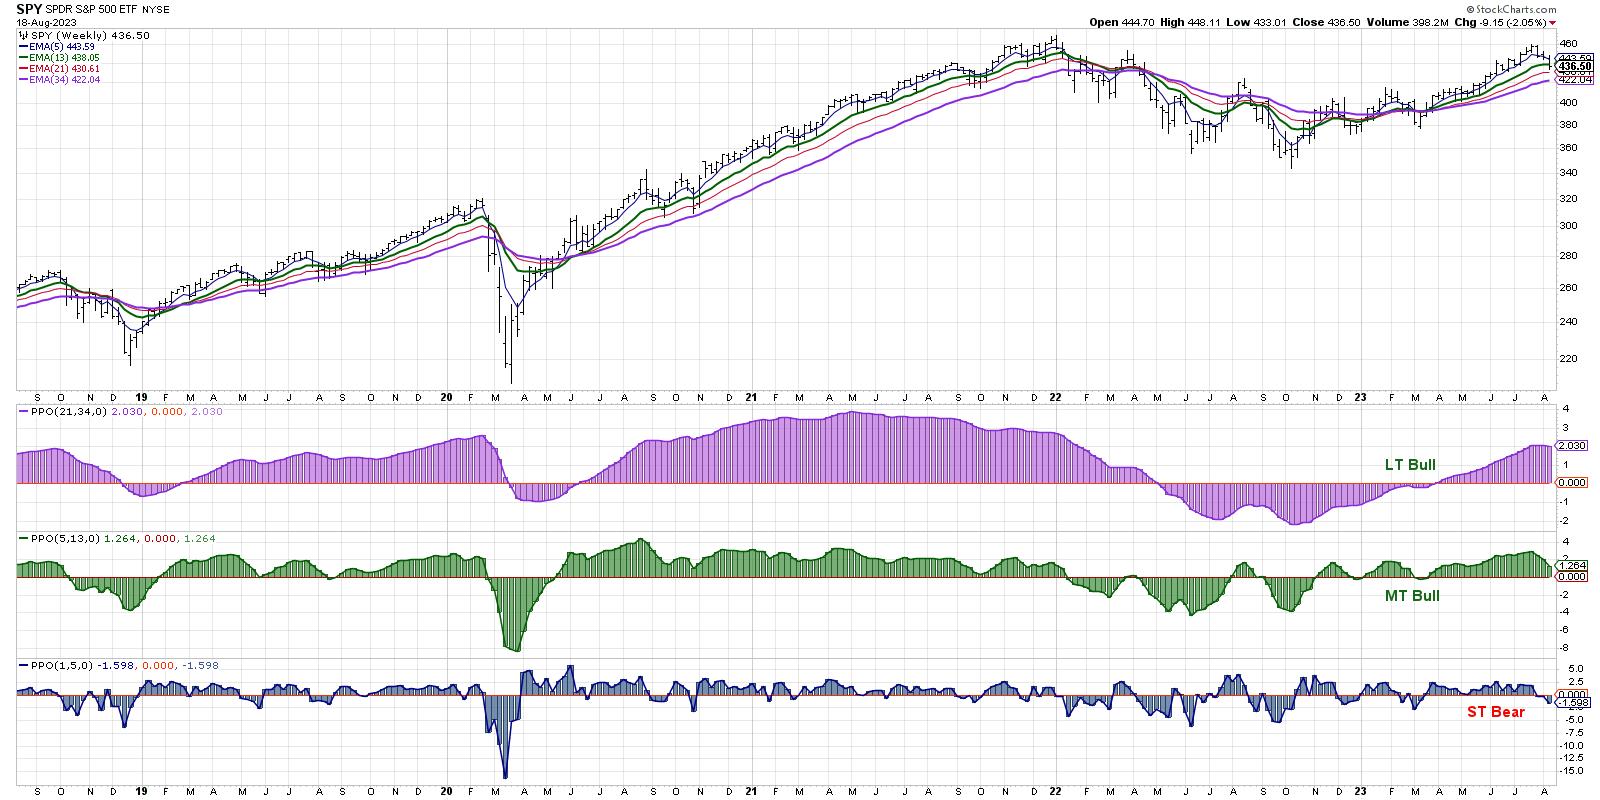
I tend to use the medium-term model as a primary indicator of "risk-on" or "risk-off" conditions, so this would suggest that, even though we've seen short-term weakness, the primary trend is still higher.
A chart of the S&P 500 and Nasdaq, which I use as a New Dow Theory indicator inspired by Charles Dow's original work, shows that the S&P 500 index is still above a trendline, using closing prices from October 2022 and March 2023.
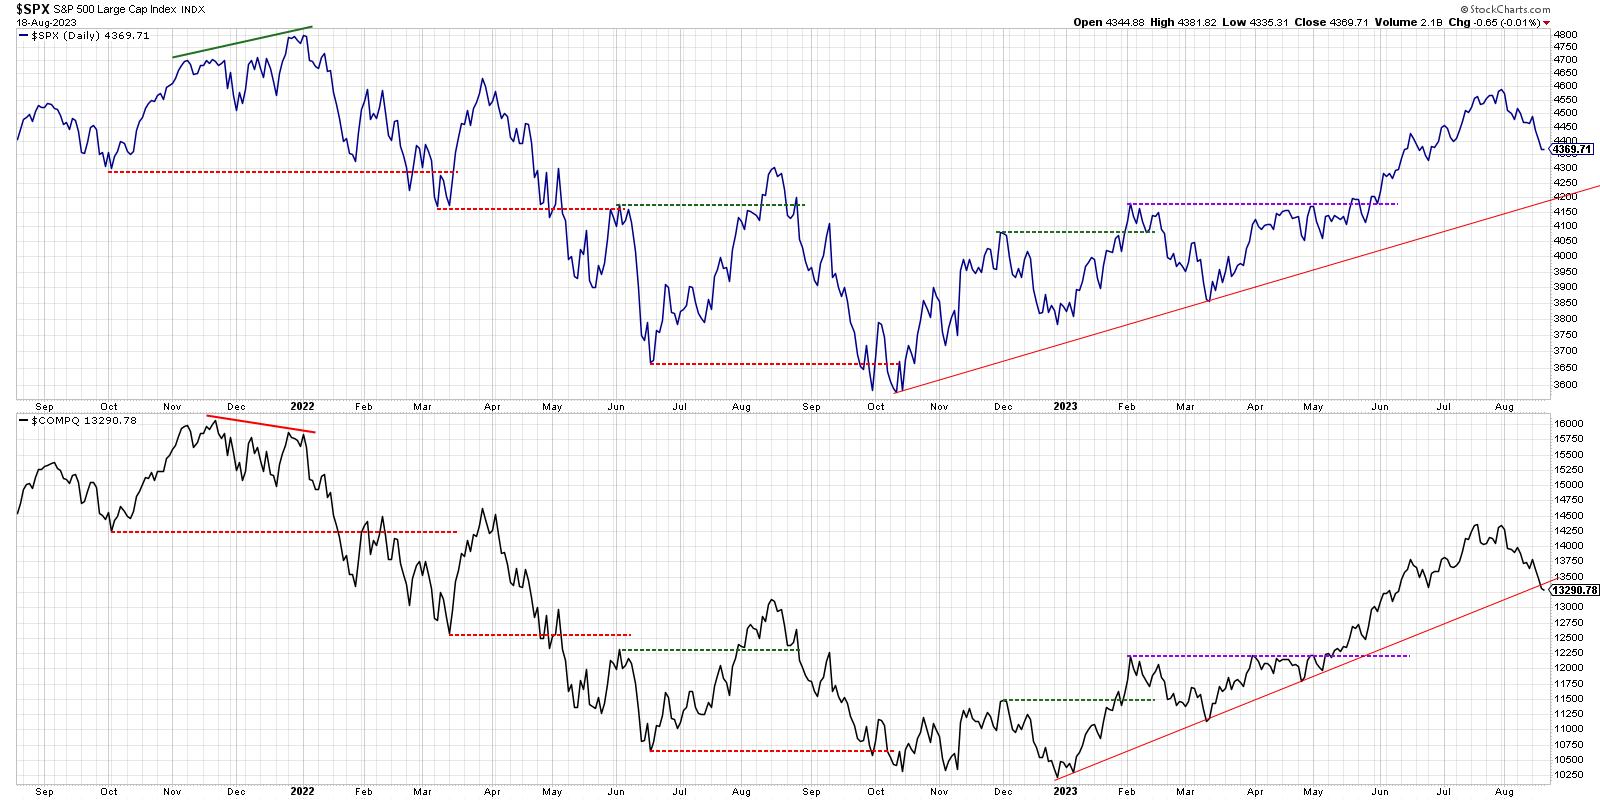
Here's the problem. Note how the growth-dominated Nasdaq 100 ETF has already broken down through a similar trendline? An argument could be made that the current selloff is being driven by growth stocks, but could eventually be magnified when everything else starts to rotate lower. That leads me to market breadth indicators, where we'll focus on the 50-day moving average.
About four weeks ago, 90% of the S&P 500 members were above their 50-day moving average. Now that reading is closer to 35%.
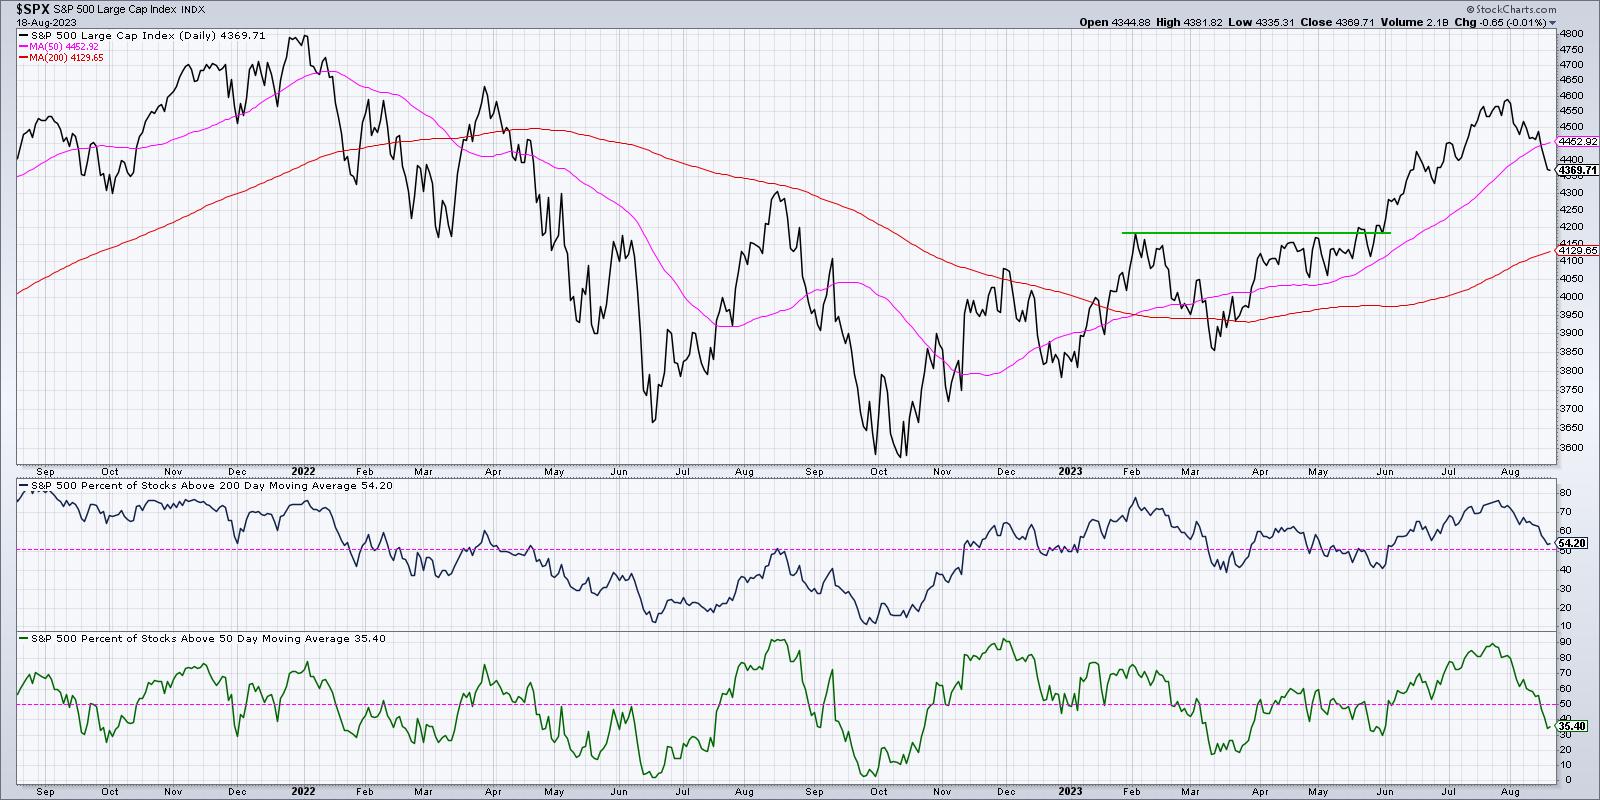
Even more concerning is the panel just above, which shows the percent of S&P 500 stocks above their 200-day moving average. Generally speaking, bulls should want this indicator to remain above 50%, because waterfall declines tend to happen when more than half of the S&P 500 members are unable to hold this key long-term barometer.
The last three times that this indicator dipped below 50%, it ended up being a buyable dip. Signals in May 2023, March 2023, and December 2022 were all higher lows. But look further to the left and you can see that a breakdown like this has also been the beginning of much larger declines in terms of price and time. So while there's a chance it's a brief pullback, there's also a chance that it's much worse from here.
What Would Confirm Further Downside?
I would say that as long as a pullback here stalls out above SPX 4200, then you have to consider this a tactical pullback within a primary uptrend. This would mean that the S&P 500 remains above the 38.2% Fibonacci support level, as well as important trendline support based on the October 2022 and March 2023 levels.
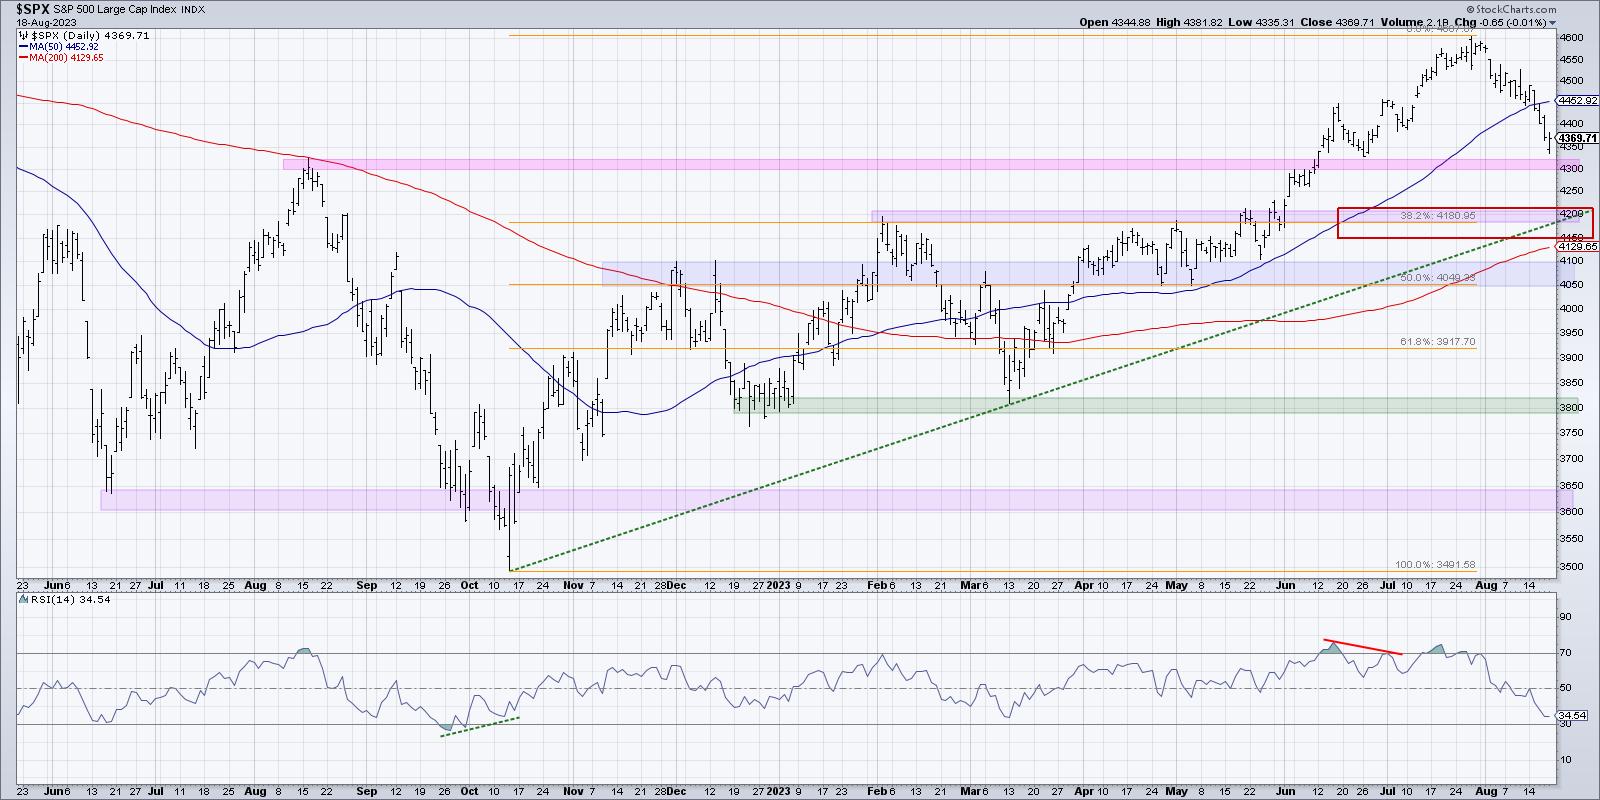
The 200-day moving average should not be too far below either, likely in the 4150-4200 range depending on how quickly this decline would progress. So we have a confluence of support, with multiple indicators all keying in on the same level.
But what if the S&P fails to find support at 4200? I was taught that all large losses begin as small losses. If we're unable to hold 4200, then the chances of a waterfall decline increase in a big way. In that scenario, mega-cap growth names would have moved much lower in August, and an absence of buyers would lead to additional selling as investors run for the exits.
We've already seen bearish momentum divergences, initial breakdowns of short-term moving averages, and meaningful declines in breadth indicators. All that's left is a fail to hold key support. If that happens, be prepared for further downside potential.
What Would Negate the Bearish Thesis?
To be clear, I hope this bearish scenario does not play out. I believe 4200 will hold, and the seasonal studies would suggest that the fourth quarter will likely be stronger than a generally weak third quarter. So what would confirm to me that the bear thesis is no longer playing out as outlined above?
In the words of legendary technical analyst Paul Montgomery, "The most bullish thing the market can do is go up." Quite simply, prices of risk assets would have to stop going down and start going up again. That would mean momentum indicators like RSI would become oversold, but then turn higher. Perhaps we would see some bullish momentum divergences as stocks approach key moving average resistance, providing a glimmer of hope in dark times.
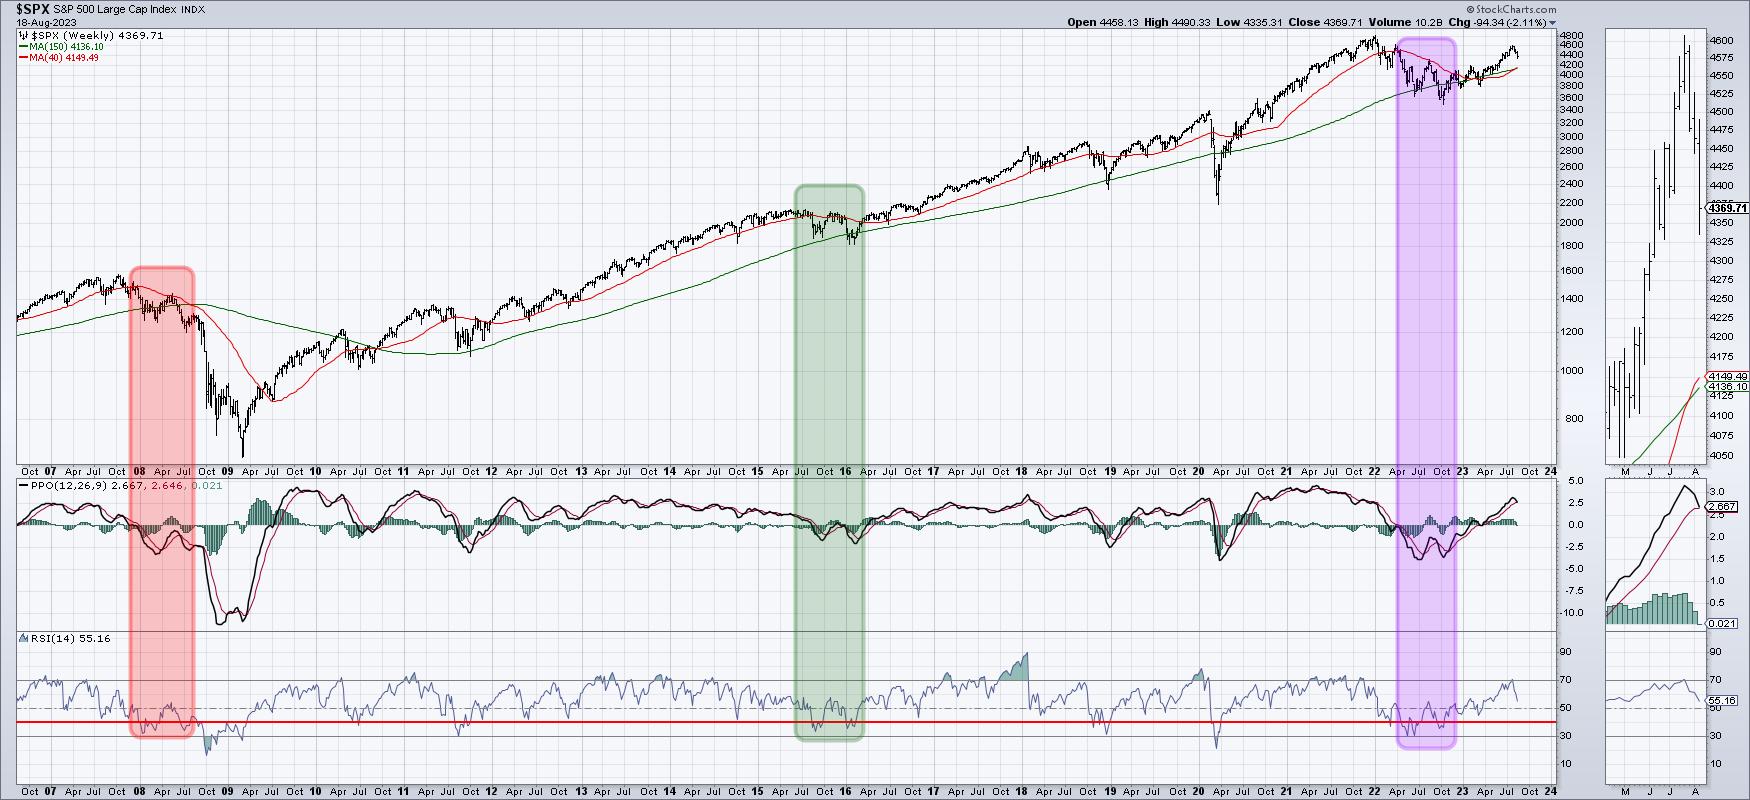
The weekly MACD, which is dangerously close to a major sell signal, would need to turn back higher. Look back in 2012 and 2013 for examples of initial sell signals that just never really materialized. Once the MACD indicator turned back higher, it often confirmed a resumption of the primary uptrend.
Whether you are bullish or bearish or decidedly undecided, it's important to consider all the possible future paths for stocks. Think about how your portfolio would weather certain conditions, how you would manage positions and minimize risk if the market moves against you, and how you would recognize the changing character of the markets.
Only by considering what could happen can we be best prepared for what will happen!
Want to learn more about probabilistic analysis and see how it works with individual stocks? Head over to my YouTube channel for a review of TSLA with four potential future paths!
RR#6,
Dave
P.S. Ready to upgrade your investment process? Check out my free behavioral investing course!
David Keller, CMT
Chief Market Strategist
StockCharts.com
Disclaimer: This blog is for educational purposes only and should not be construed as financial advice. The ideas and strategies should never be used without first assessing your own personal and financial situation, or without consulting a financial professional.
The author does not have a position in mentioned securities at the time of publication. Any opinions expressed herein are solely those of the author and do not in any way represent the views or opinions of any other person or entity.


