TAKEAWAYS
- Two key breadth indicators, the McClellan Oscillator and the Nasdaq 100 Bullish Percent Index, both registered bearish signals this week.
- While AMZN gapped higher on earnings and AAPL plunged lower, both stocks ended the week with bearish candle patterns.
- Investors can use Fibonacci Retracements along with moving averages to identify potential downside targets for the S&P 500.
As I returned from vacation last weekend and began to dig through the charts to prepare for the week, I immediately focused on Thursday with both Apple (AAPL) and Amazon (AMZN) reporting earnings. Would this provide the upside catalyst needed for the mega-cap growth stocks to find support at their 50-day moving averages?
By Friday's close, the answer appeared to be a resounding no, as a number of key market breadth indicators signaled a clear rotation from bullish phase to bearish phase. In today's article, we'll break look a little more closely at these bearish breadth indicator patterns, gauge the technical damage to stocks like AAPL after earnings, and consider some downside targets for the S&P 500.
The Market Develops Bad Breadth
As our equity benchmarks have become more top-heavy over time, given the outsized overweight of the mega-cap FAANG stocks, market breadth indicators have become much more important. Market breadth measures participation, usually using some sort of equal-weighted methodology. So while the value of the S&P 500 or Nasdaq 100 is based largely on the performance of the FAANG stocks, an equal-weighted market breadth indicator can tell you much more about the performance of all the other stocks that comprise those indices.
The McClellan Oscillator is based on daily advance-decline data for the NYSE, but smooths out the data using exponential moving averages to form an oscillator. When the indicator is above zero, conditions are bullish, and a level below zero suggests bearish conditions.
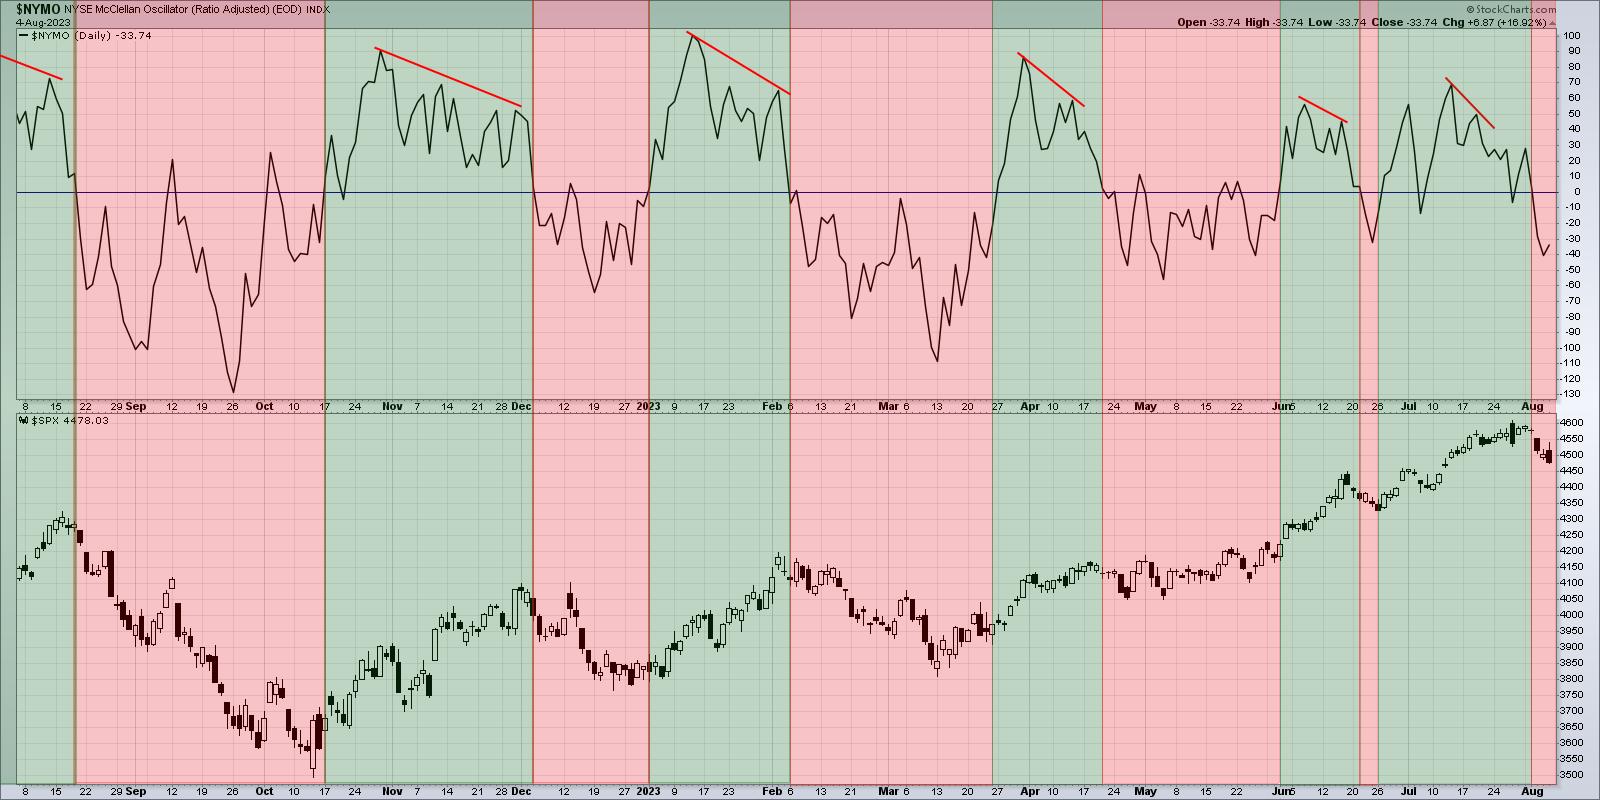
The McClellan Oscillator (top panel) just turned negative this week after being bullish through all of July. If you look back at the other red-shaded areas on the chart, you'll note that all the major pullbacks in the last 12 months have been identified with this sort of bearish rotation.
The Bullish Percent Indexes are a series of breadth indicators based on point & figure charts. Abe Cohen from ChartCraft is credited with taking the simplicity of point & figure chart and adapting the signals to create measures of market breadth.

Here, we're running a Bullish Percent Index for the Nasdaq 100 index, which means the indicator (top panel) tells you the percent of NDX names that are currently showing a bullish signal on their own point & figure chart. When the indicator breaks above 70% and then back below this extreme level, it suggests a negative rotation.
This bearish signal was triggered this week, indicating that the broad advance through July has set us up for a downside rotation into August. Note the vertical red lines which indicate previous occurrences and you'll see that the Nasdaq 100 has pulled back to some degree pretty much every time this signal has dropped.
When the market moves higher on stronger breadth, that confirms a broad and healthy advance, with many stock participating in the upside phase. When these breadth indicators turn back negative, as they have this week, it usually confirms the end of the previous bullish phase.
AAPL and AMZN Appear Similar Until They Don't
It's always newsworthy when the largest companies are reporting earnings, and this week did not disappoint, with two of the FAANG stocks announcing their latest results on Thursday. What's so interesting about this particular set of results is that the two stocks -- AAPL and AMZN -- had very similar technical setups going into their earnings report, but two very different reactions soon after.
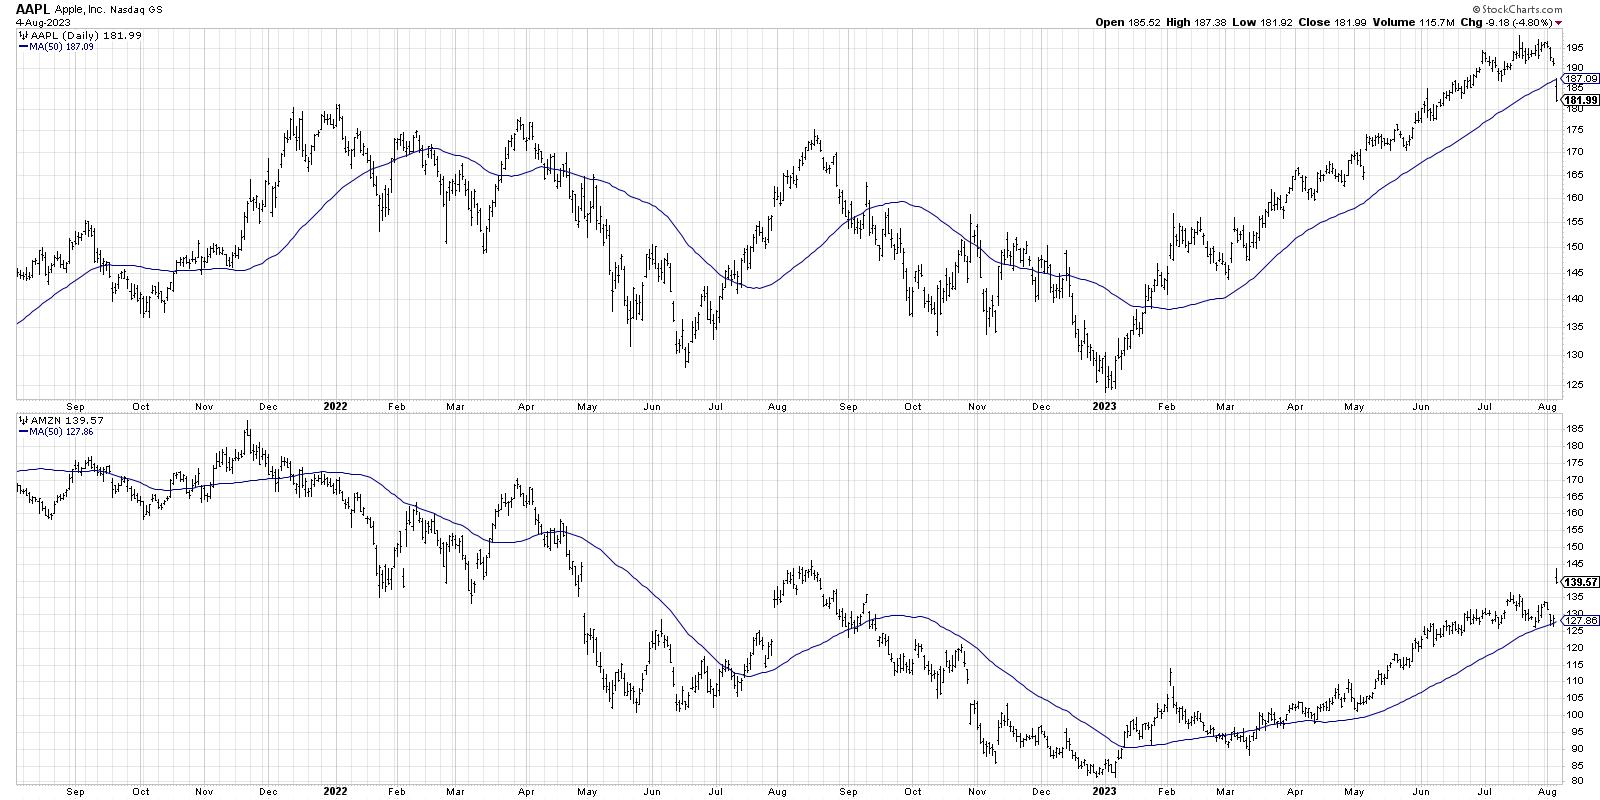
Both stocks have been above an upward-sloping 50-day moving average, confirming a consistent uptrend phase. Both names pushed to a new swing high in July, and both saw weaker price momentum going into that new high as the pace of the advance began to dissipate.
After both companies reported earnings on Thursday, Amazon gapped up by about $13, while Apple gapped down to open about $7 lower. What's very telling, however, is that both stocks finished near their low for the session.
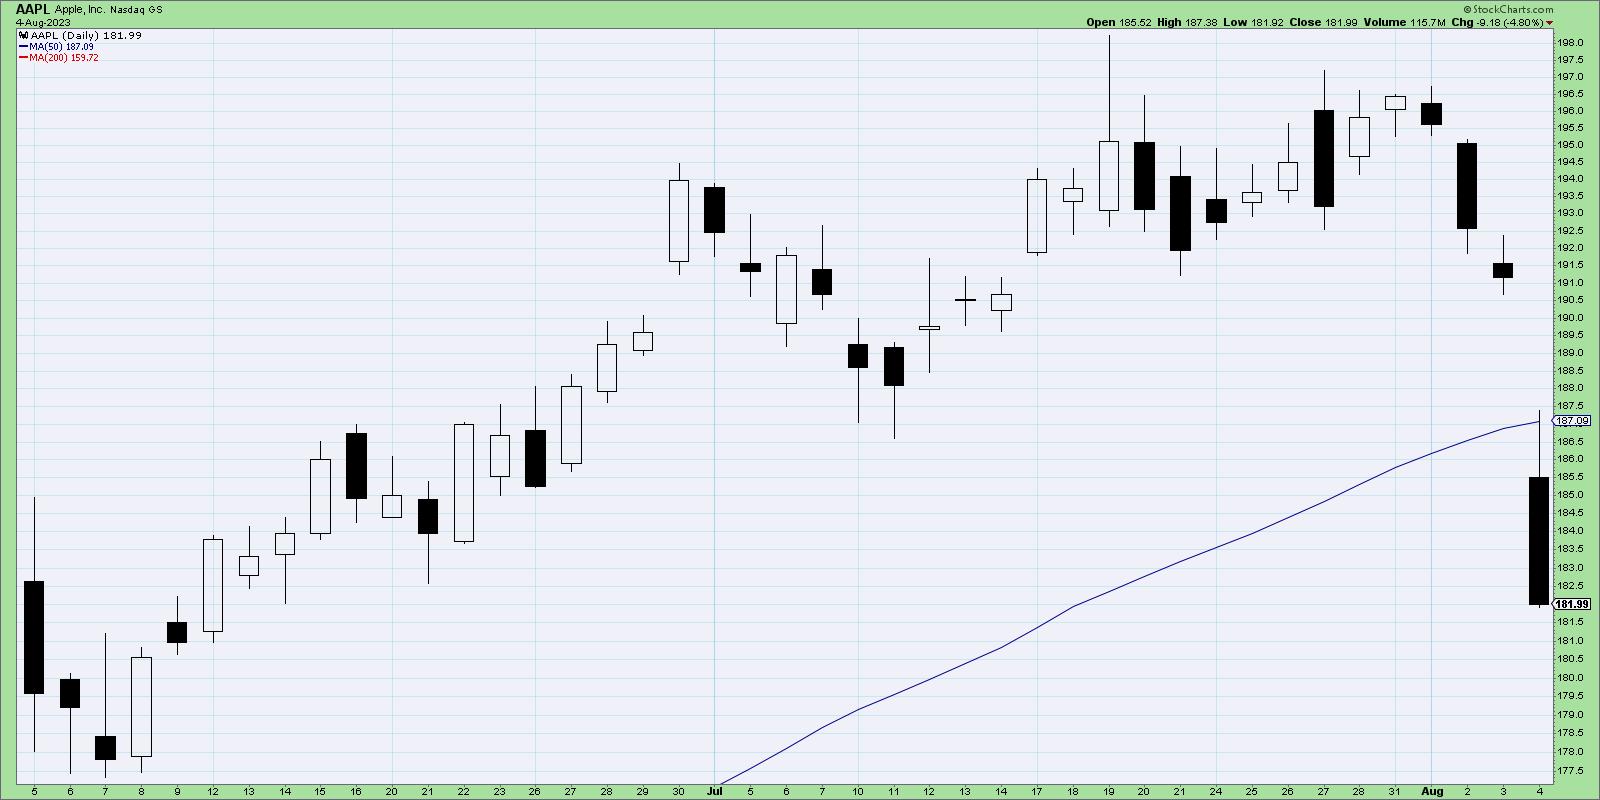
Now we're looking at a two-month daily candle chart of AAPL, which magnifies Friday's gap below the 50-day moving average. So after the gap lower at the open, the price rallied into mid-day, only to rotate lower in the afternoon to close at the low. So that means that, while some buyers jumped in and bought AAPL at a discount from Thursday's close, eventually sellers took control and pushed the price even lower.
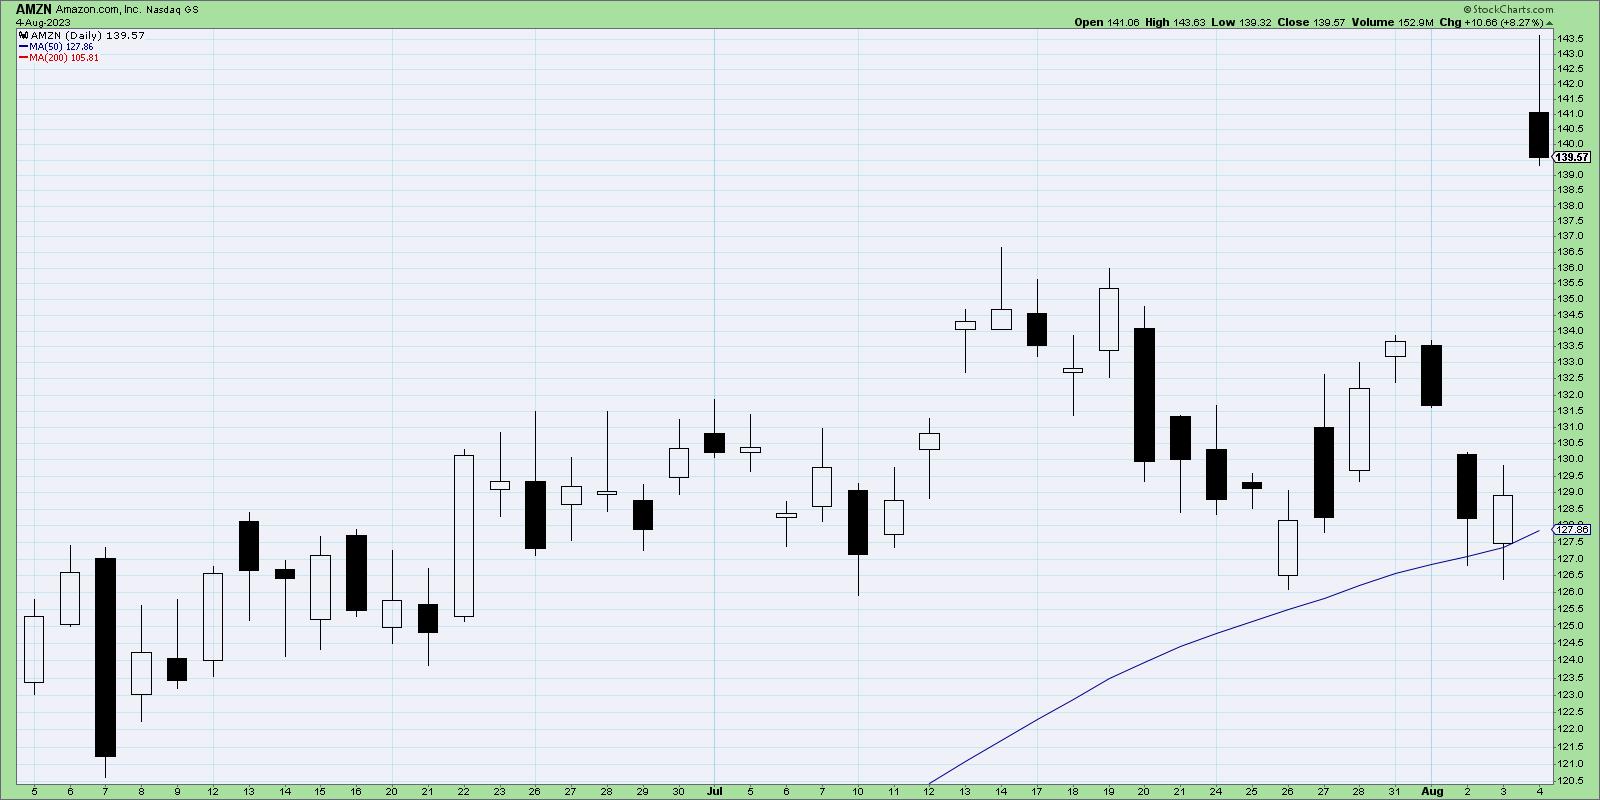
AMZN actually gapped higher on Friday, pushing the price well away from its 50-day moving average. But note Friday's candle, which is called a "shooting star" pattern. This is where the open and close are near the lows of the day, and there is a long upper shadow. This shows that, while the stock did gap higher on the earnings beat, the end of the day was marked by profit-taking as investors were willing to cash in after the bounce higher.
In both cases, the short-term reaction on Friday after earnings suggest that market participants were happy to get out of these names going into the close. This lack of buying power into next week could lead to much further downside for these and other growth stocks.
Considering Downside Targets for the S&P 500
When a chart begins to rotate from a bullish phase to a bearish phase, it's always a good idea to start thinking about downside objectives. If for no other reason, it forces you out of your predetermined narrative and encourages you to consider different probabilistic outcomes.
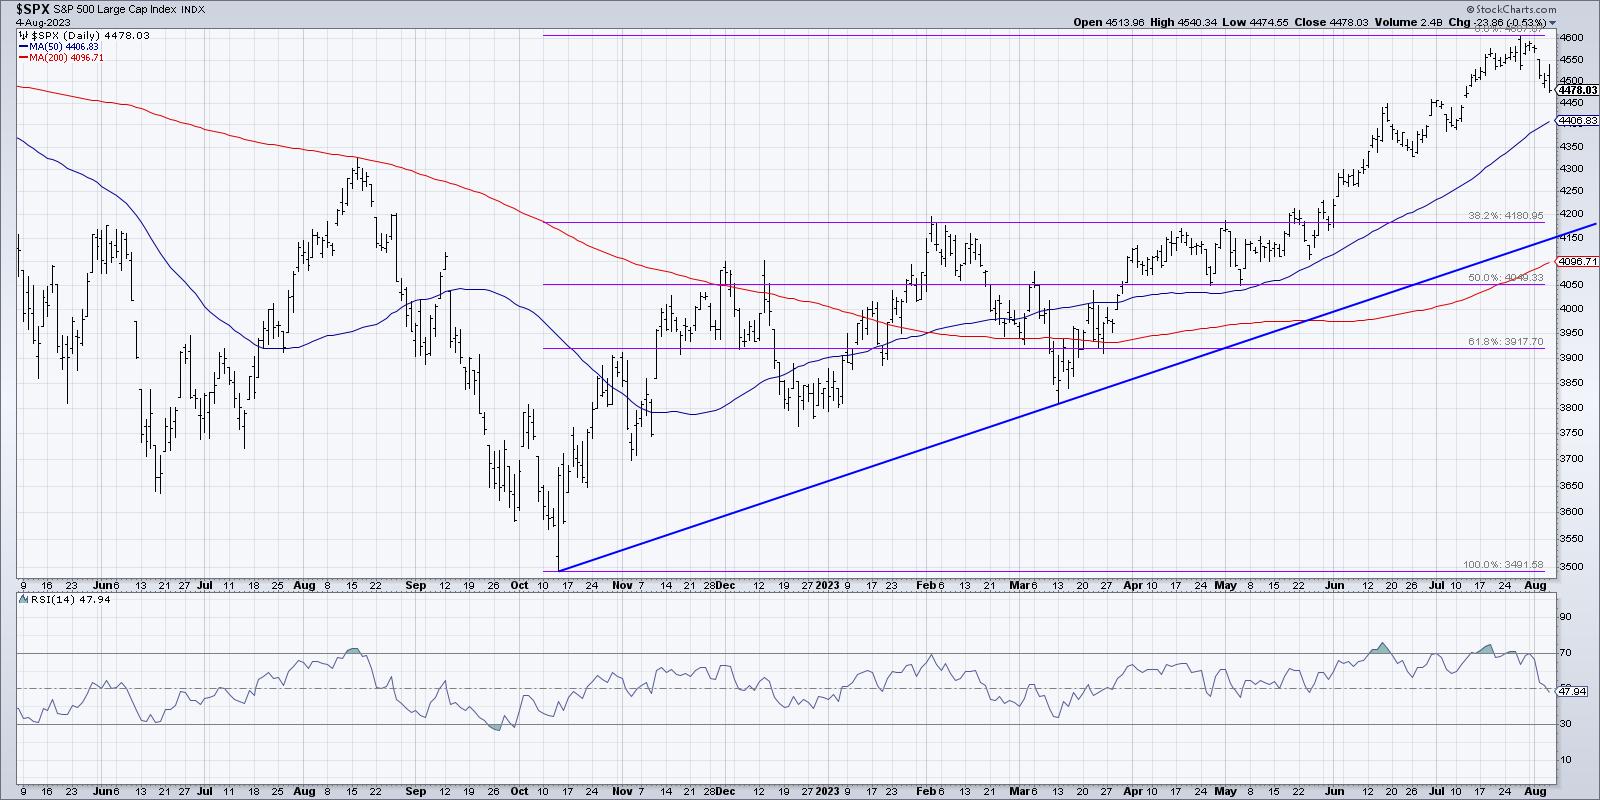
Assuming the S&P 500 has reached its peak for this part of the cycle, and is indeed heading lower in August, I'm immediately drawn to the 4200 level for two reasons. First, this would represent a 38.2% retracement of the bullish phase from October 2022 to July 2023. Second, it would bring the price down to a trendline using the October 2022 and March 2023 lows.
Depending on how long it would take to reach that price level, the 200-day moving average could end up being right around that level as well. So there we have three different technical indicators all indicating around 4200 as a reasonable downside target.
A move down to S&P 4200 would mean about a 9% pullback from the July high around 4600. If you study your market history, you'll see that even the most bullish years usually have two to three pullbacks of around 5-10% each. So this sort of further drop would not be unusual at all, but rather just the normal push and pull of the stock market cycle.
Our latest YouTube video digs into the bearish rotation in market breadth indicators, along with background on how they are derived!
RR#6,
Dave
P.S. Ready to upgrade your investment process? Check out my free behavioral investing course!
David Keller, CMT
Chief Market Strategist
StockCharts.com
Disclaimer: This blog is for educational purposes only and should not be construed as financial advice. The ideas and strategies should never be used without first assessing your own personal and financial situation, or without consulting a financial professional.
The author does not have a position in mentioned securities at the time of publication. Any opinions expressed herein are solely those of the author and do not in any way represent the views or opinions of any other person or entity.


