TAKEAWAYS
- The ARK Innovation ETF has been a chronic underperformer in recent years, but 2023 has seen a dramatic turnaround.
- The top holdings of ARKK, especially TSLA, COIN, and ROKU, have been the source of key gains this year.
- Renewed strength from emerging technology is part of a broader rotation away from the dominance of the FAANG stocks.
The ARK Innovation Fund has been going down for a while now. In fact, I've become so used to ARKK underperforming the S&P 500 that I almost did a double take last month when I recognized that the trend appeared to have changed.
Today, we'll discuss why this ETF has been a chronic underperformer, how the top holdings of ARKK have fueled a dramatic turnaround to a bullish phase, and what renewed strength in emerging technology plays means for the markets.
Endless Downside for ARK Innovation
There's no denying that Cathie Wood has done an impeccable job marketing her firm and her methodology for identifying potential winners. The reality, however, has been a story of chronic underperformance.
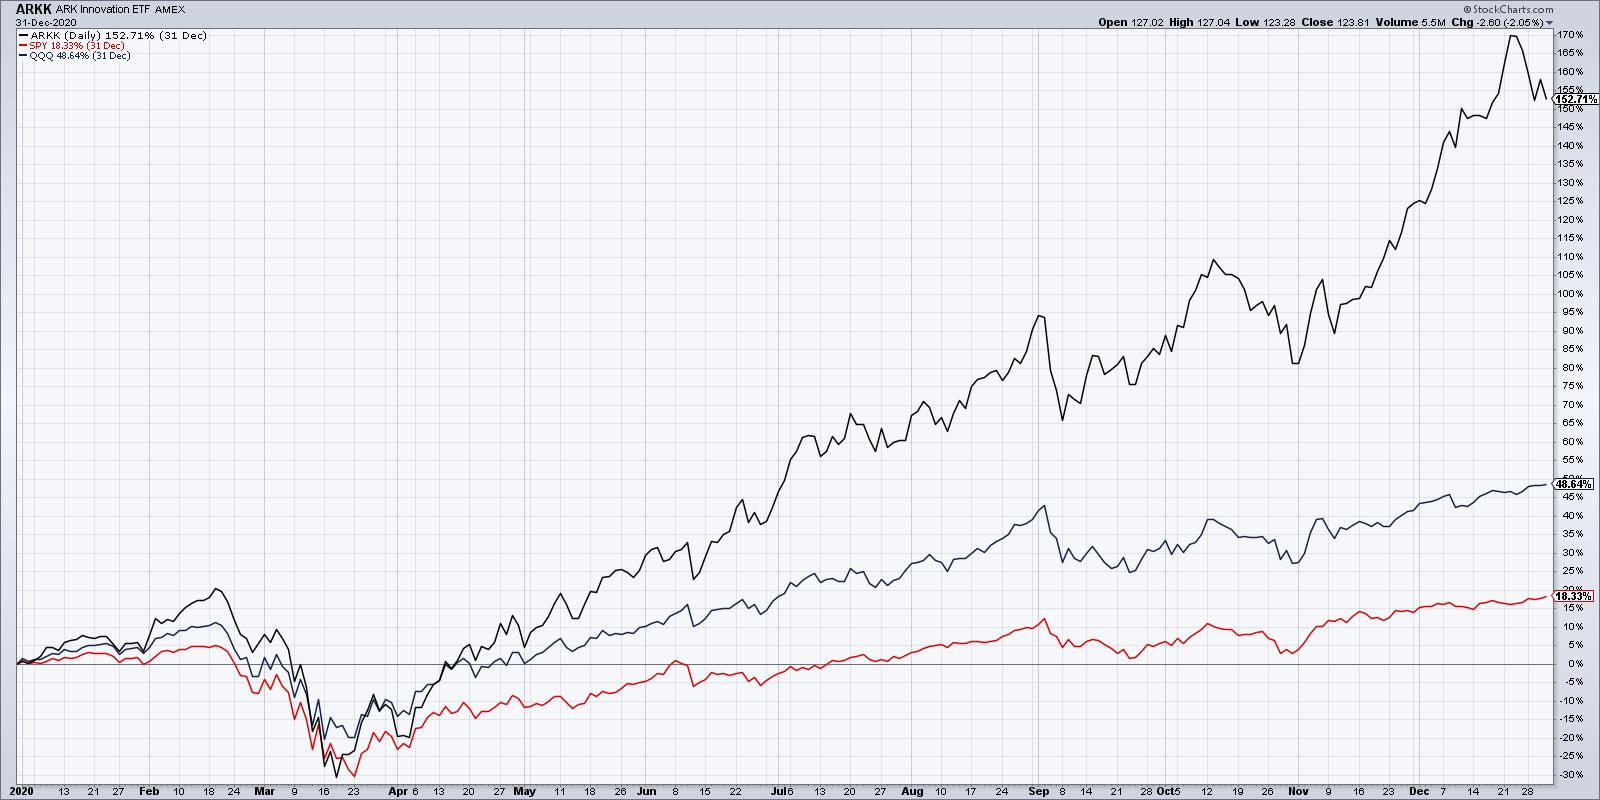
In 2020, in the depths of the COVID pandemic, ARKK was up over 150% for the year. This far outpaced the 49% gain for the Nasdaq 100 and the measly 18% rise for the S&P 500. While we were wiping off every individual grape in the grocery bag and settling in for a long stretch of working from home, the technologies that allowed that to happen drove ARKK's holdings to a strong year for performance.
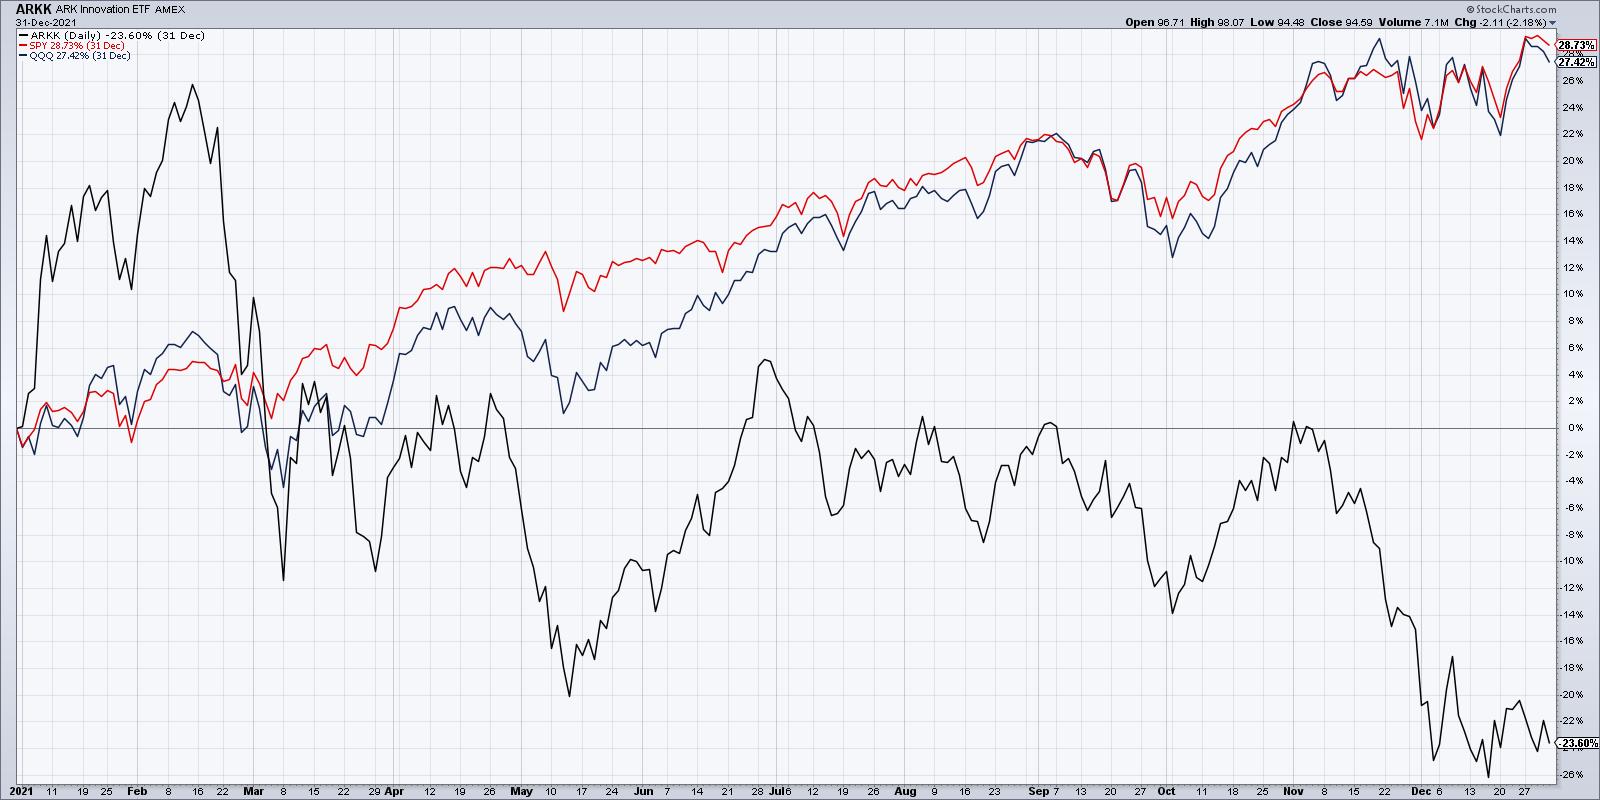
In 2021, leadership shifted in a big way, with the mega-cap FAANG stocks starting to dominate our thinking, and the initial rally in pandemic names like PTON and ZM started to fizzle. ARKK was down 24%, while the Nasdaq 100 and S&P 500 both gained over 26% for the year.
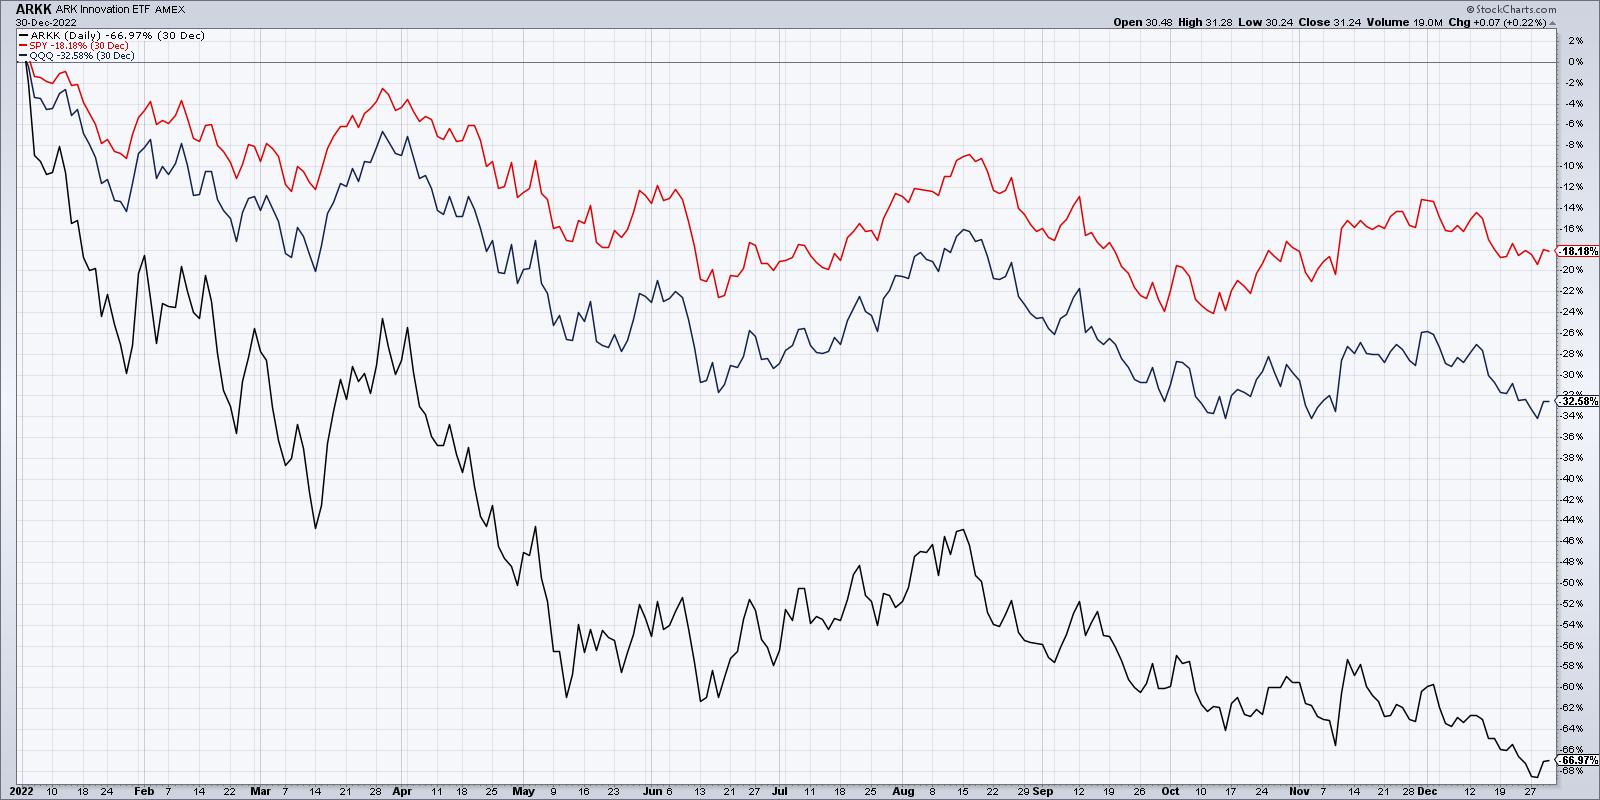
In 2022, the bear market drove everything lower, and ARKK's -67% for the calendar year meant it again dramatically underperformed the major averages. The Nasdaq 100 was down about 33% in 2022 and the S&P 500 shed 18% of its value.
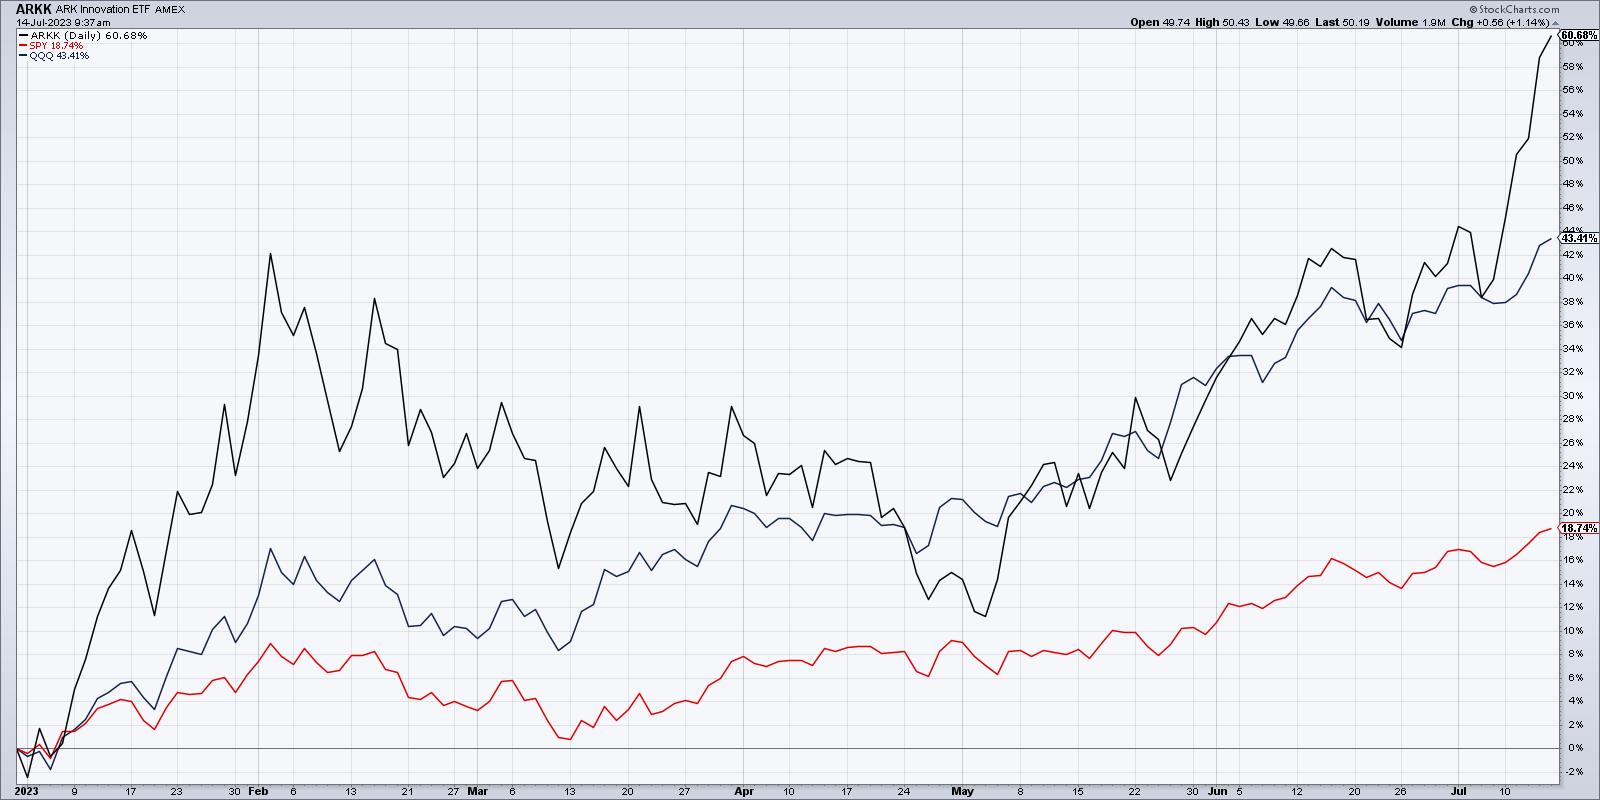
That brings us to 2023, where the ARK Innovation ETF has gained over 60% year-to-date, tripling the return on the S&P 500 and far outpacing the Nasdaq 100's 43% gain. The names that were hurting ARKK's returns the most now appear to be driving the fund to a strong year of outperformance.
So basically, as long as emerging technology is considered market leadership, the ARK Innovation ETF has been a fantastic play to take advantage of that theme. Unfortunately, that has not been the case since 2020. Perhaps now, it's time to revisit this theme?
Breaking Down the Top Holdings
Let's go through the five top holdings of the ARK Innovation Fund, and see how this ETF has been able to turn around performance and turn up the returns.
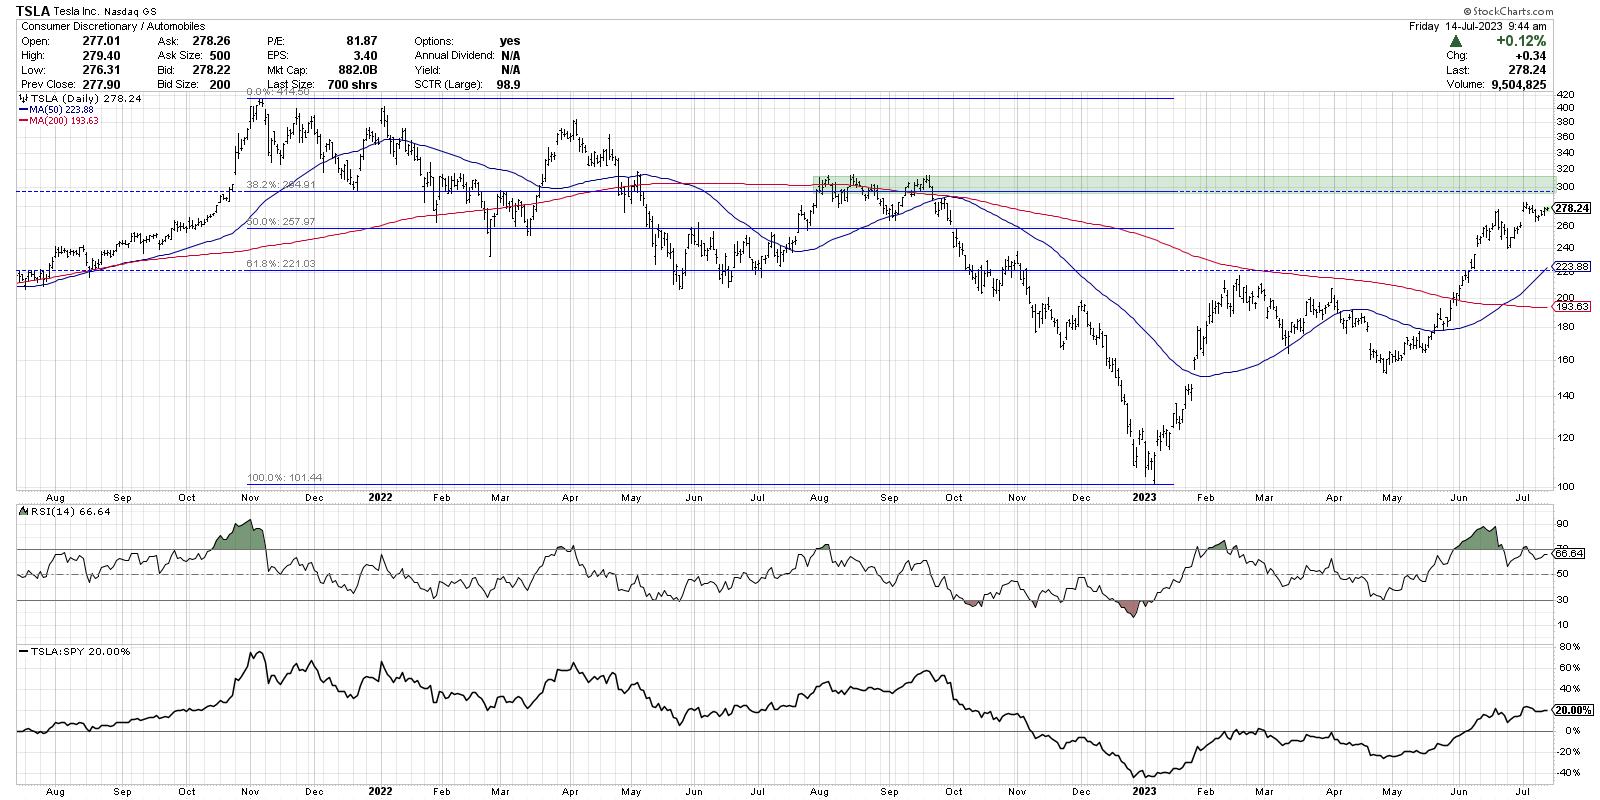
ARKK's biggest position is Tesla (TSLA), and it's interesting to note that TSLA actually made a new low in January while the S&P 500 and Nasdaq bottomed out in October. After an initial rally to start the year, the stock pulled back in March and April before turning higher in May. That February peak was right around a 38.2% retracement of the November 2021 to January 2023 selloff.
Now we see TSLA is approaching "big round number" resistance around $300, which also represents the 61.8% Fibonacci retracement level. A series of price peaks around $310 tells me to expect resistance in the $300-310 area, shaded in green on my chart.
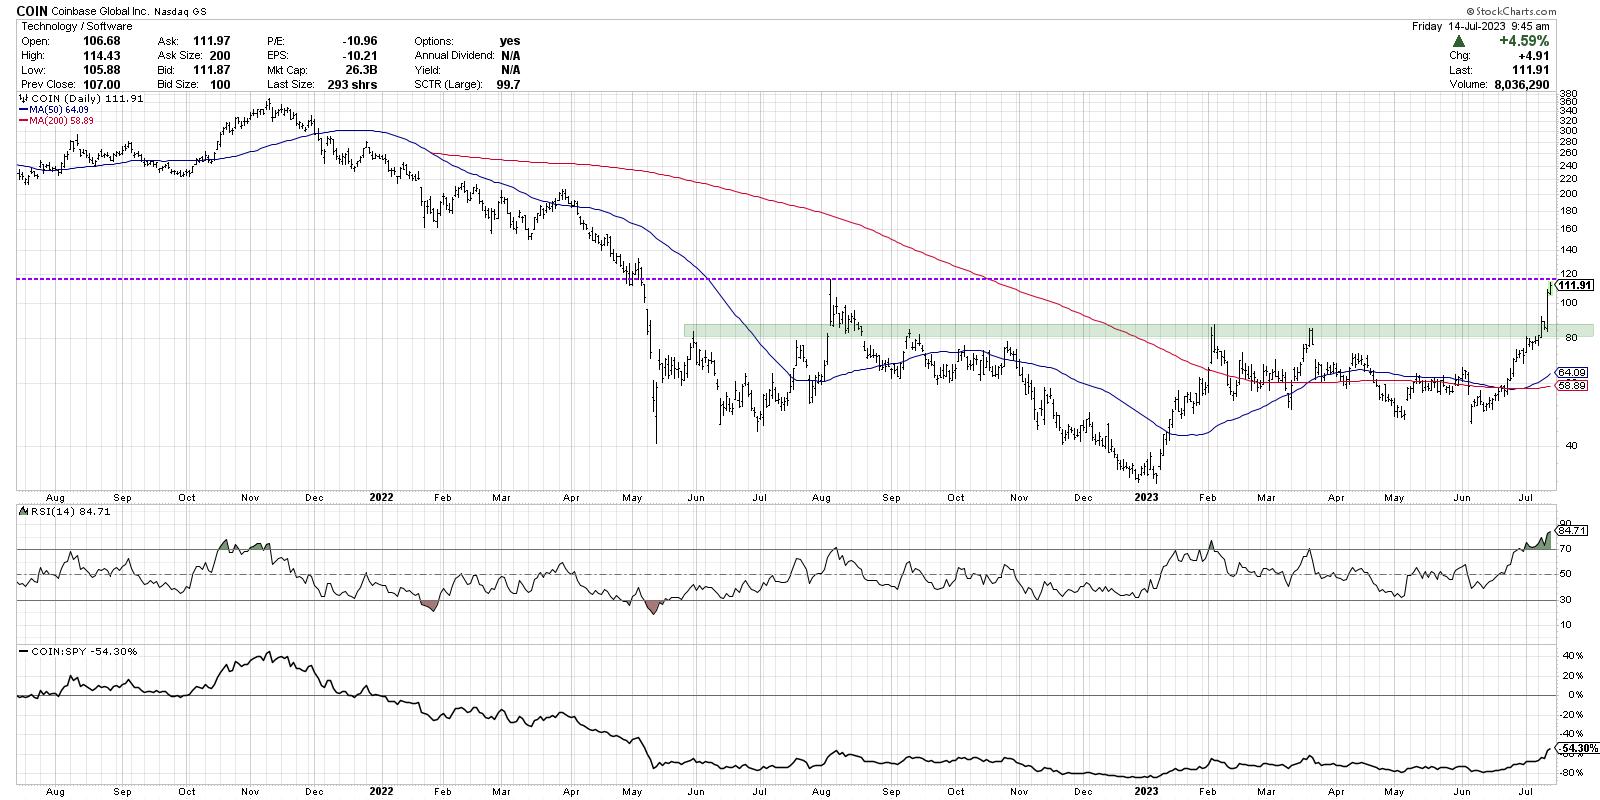
Coinbase (COIN) has ridden the crypto recovery theme higher in 2023, and this week brought further upside catalysts for a stock that has already tripled off its January low. The February and March highs just above $80 were my main resistance zone, and that was broken with authority this week en route to pushing above $100 and beyond.
Now, the August 2022 high is in play, and the extremely overbought conditions suggest to me that there is most likely more gas left in the tank. The kicker is that once COIN breaks above $120, there isn't much technical resistance until all the way up to around $200.
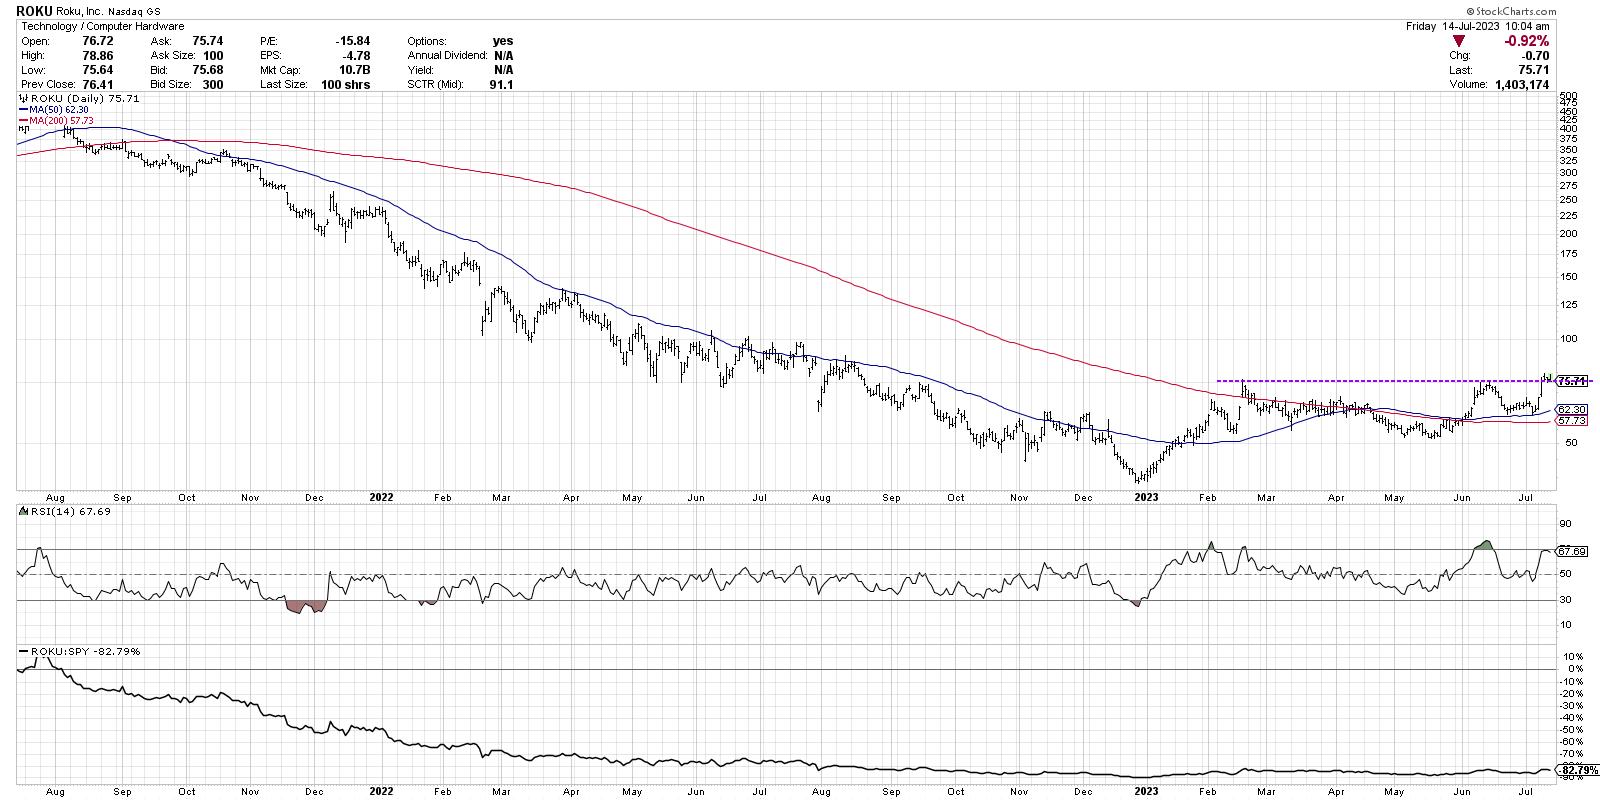
The chart of Roku (ROKU) is the story of ARKK in a nutshell. The left two-thirds of my chart display a painfully consistent downtrend of lower lows and lower highs. But that just makes the clear higher low in May of this year that much more meaningful!
Now the stock has completed a classic rotation above the 200-day moving average, and this week pushed to a new swing high above $75. As long the $75 level holds, I would say this is a confirmed uptrend.
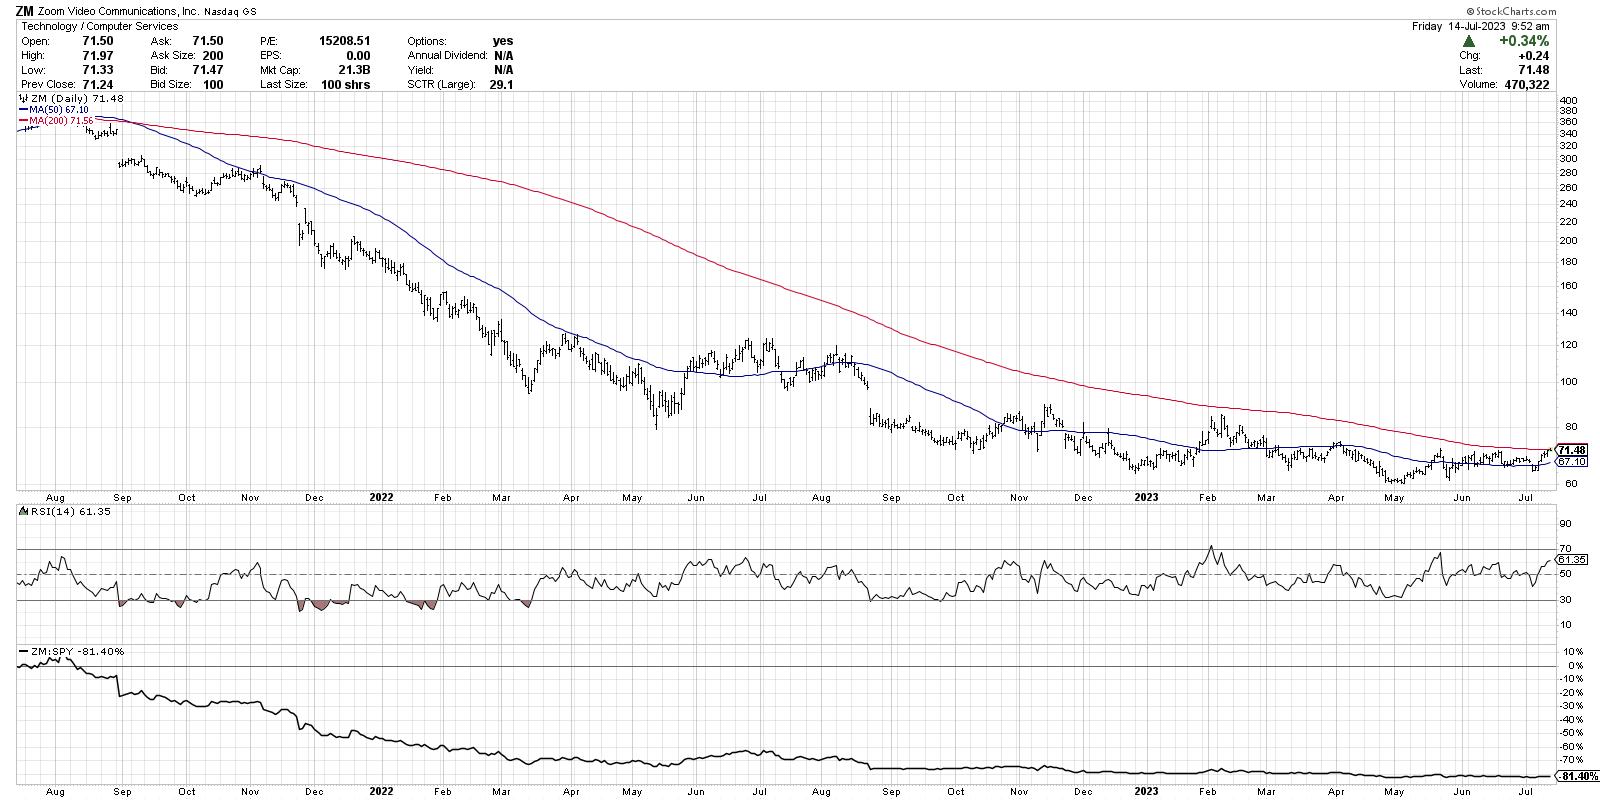
Now we have our first example of a key holding that still looks like it's in a downward spiral. While all the previous stocks we discussed bottomed out in January, Zoom (ZM) actually made a new low again in May. For now, the $60 level has held as support, but I've not seen enough buying power on the chart to confirm an upside reversal.
The stock is now testing its 200-day moving average, which means it could "pull a ROKU" and complete that bullish rotation. But it just hasn't done so yet.

Block (SQ) is another chart that I would say still has much to prove. The May low around $55 is right around the October 2022 low, so, for now, support has held fast. But until this chart pushes above well-established resistance around $90 (pink dashed line), I would consider this a basing pattern and not much more.
Renewed Strength In Forgotten Stocks
What does it mean that charts like ROKU have seen such a dramatic rotation from bearish phase to bullish phase? And how does that relate to the bearish divergences we've seen in the mega-cap growth stocks?
I would say this is part of a larger rotation away from the dominance of the FAANG stocks and into other areas of the market. And I think that's not just about the smaller technology names and small-cap stocks, but also other sectors like industrials and financials, which are also catching a bid here.
The story of the first half of 2023 was a story of narrow leadership and the mega caps versus everything else. Now, we are seeing a bit of an "everything rally" that includes other asset classes like commodities and cryptocurrencies.
We still may see some bearish pullback scenarios play out, and it's always worth considering the implications of a broader decline in the major benchmarks. But for now, the strength in charts like ARKK suggest that the bullish market phase has more upside in store.
RR#6,
Dave
P.S. Ready to upgrade your investment process? Check out my free behavioral investing course!
David Keller, CMT
Chief Market Strategist
StockCharts.com
Disclaimer: This blog is for educational purposes only and should not be construed as financial advice. The ideas and strategies should never be used without first assessing your own personal and financial situation, or without consulting a financial professional.
The author does not have a position in mentioned securities at the time of publication. Any opinions expressed herein are solely those of the author and do not in any way represent the views or opinions of any other person or entity.


