This past week had all the potential to see a revival of the great bull market of 2023. The September inflation data, Apple's latest product announcements, and Arm's IPO all seemed had the possibility to reignite the fire of bullishness for investors.
By Friday's close, however, the S&P 500 appeared to be limping into the weekend. Growth stocks struggled and defensive sectors thrived as the market took on a very risk-off feel to wrap the week.
With this week's pullback, the S&P 500 chart appears to be forming a potential head-and-shoulders pattern.
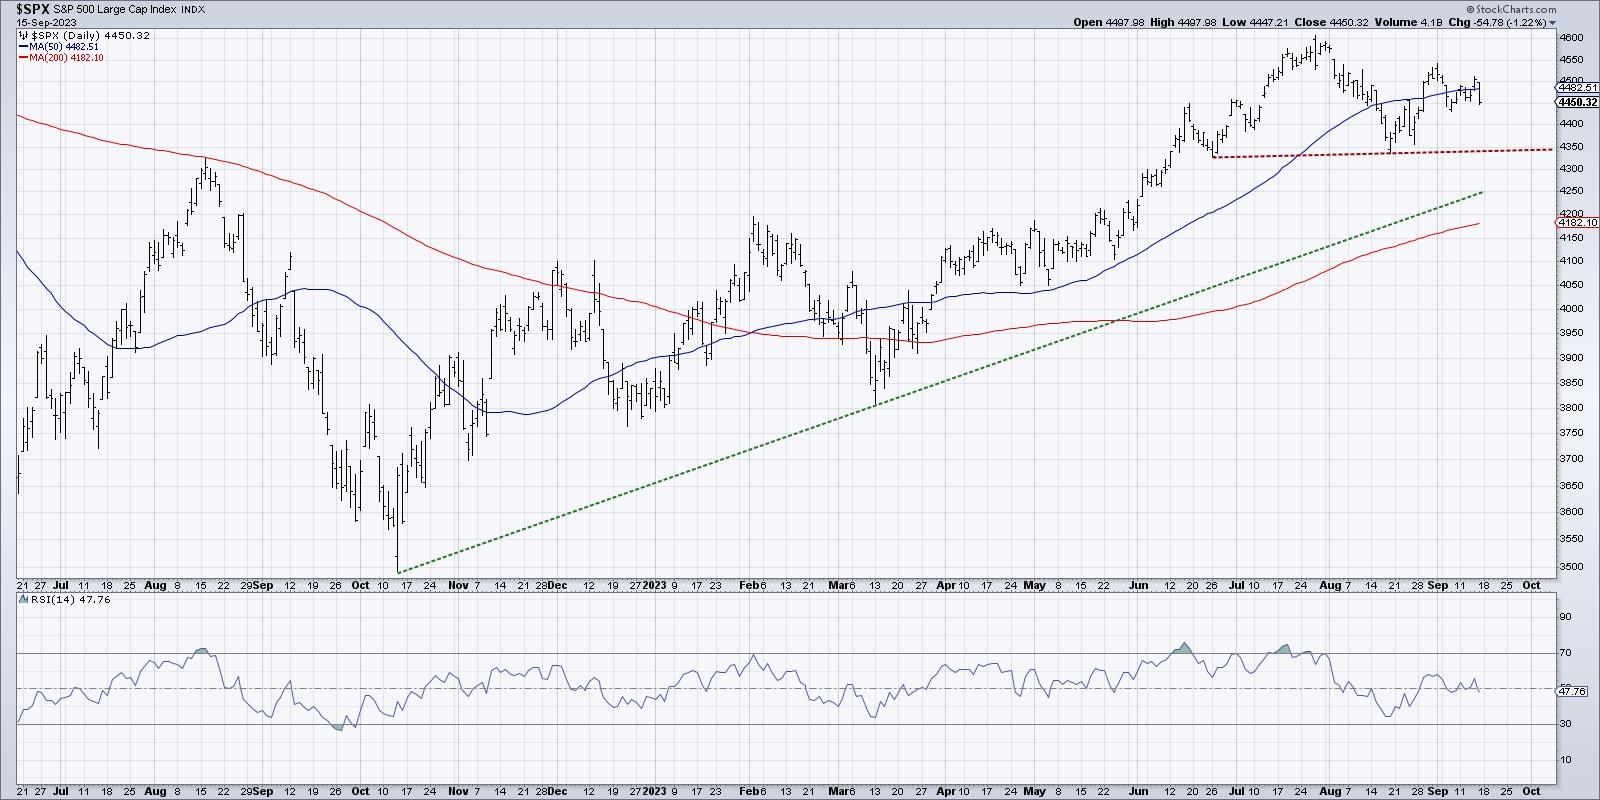
Note the peak in late July around 4600, surrounded by lower highs in June and August. If and when the SPX can break below the "neckline" formed by the interim lows in June and August, that would suggest further deterioration to at least the 200-day moving average.
Let's look at three key ETFs, all showing signs of distribution, all with further downside potential, and all with implications for further deterioration in risk assets.
Semiconductors (SMH)
Semiconductor stocks have done quite well since the October 2022 low, with the strong relative strength demonstrating consistent outperformance over the S&P 500 index. This ETF beautifully illustrates the dominance of large-cap growth stocks over other cap tiers in 2023.
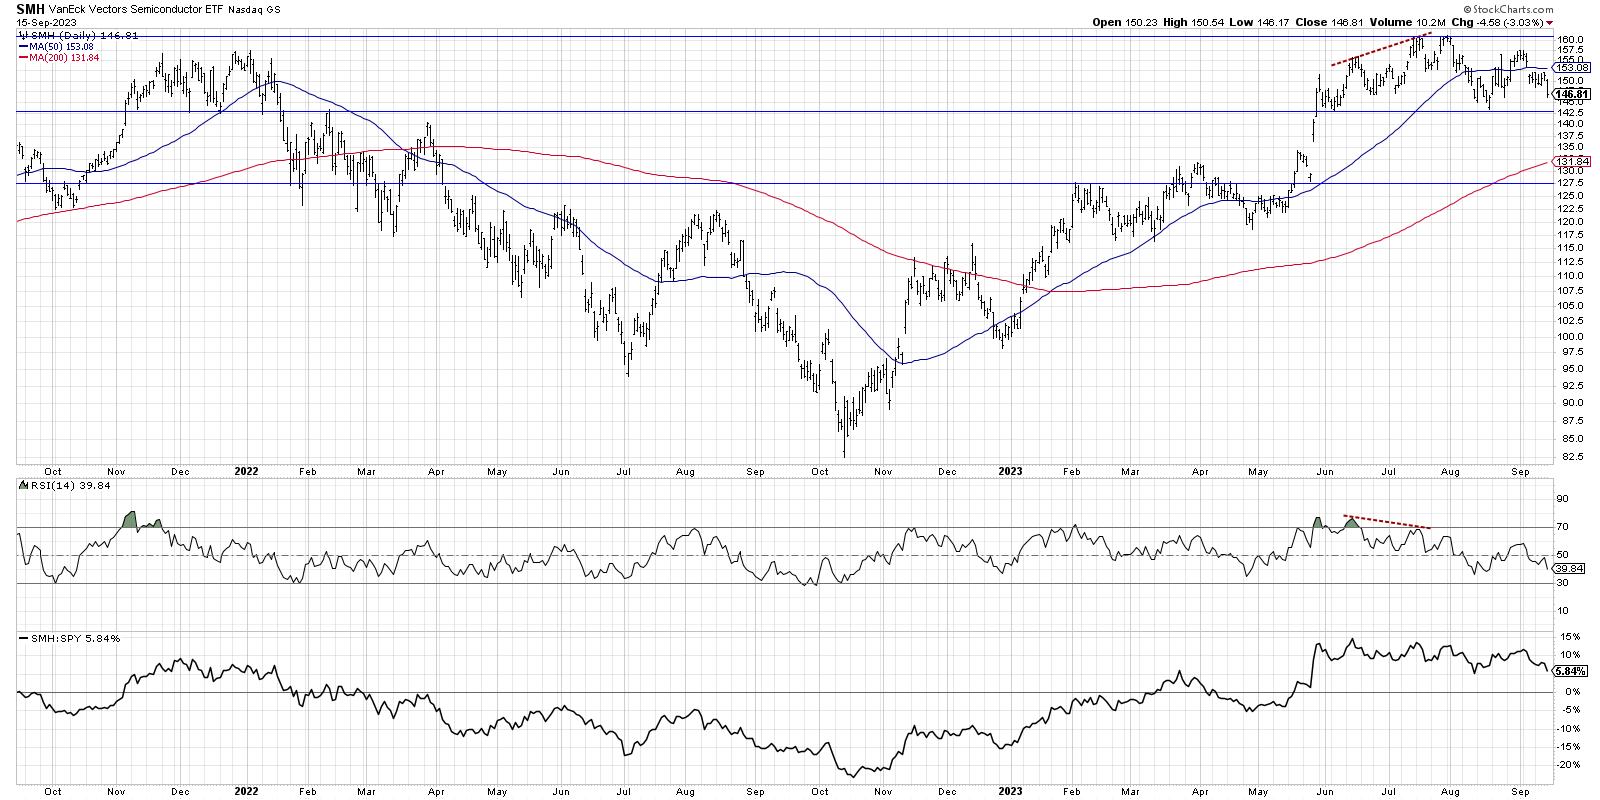
In July, we noted a bearish momentum divergence, where price moved higher while the RSI trended lower. This pattern often indicates an exhaustion point during bull phases, and suggests limited upside due to weakened positive momentum.
After testing resistance around $160 twice in July, the SMH registered a lower high in late August. If the price would push below $142, that would mean a new lower low as well. Given the weakened relative strength profile and negative momentum swing, there appears to be very real potential for further downside in this bellwether industry group.
Homebuilders (ITB)
For most of 2023, homebuilders were firing on all cylinders with consistent new highs and a steady uptrend for relative strength. Momentum characteristics, as measured by the RSI indicator, were similar to previous bullish market phases.
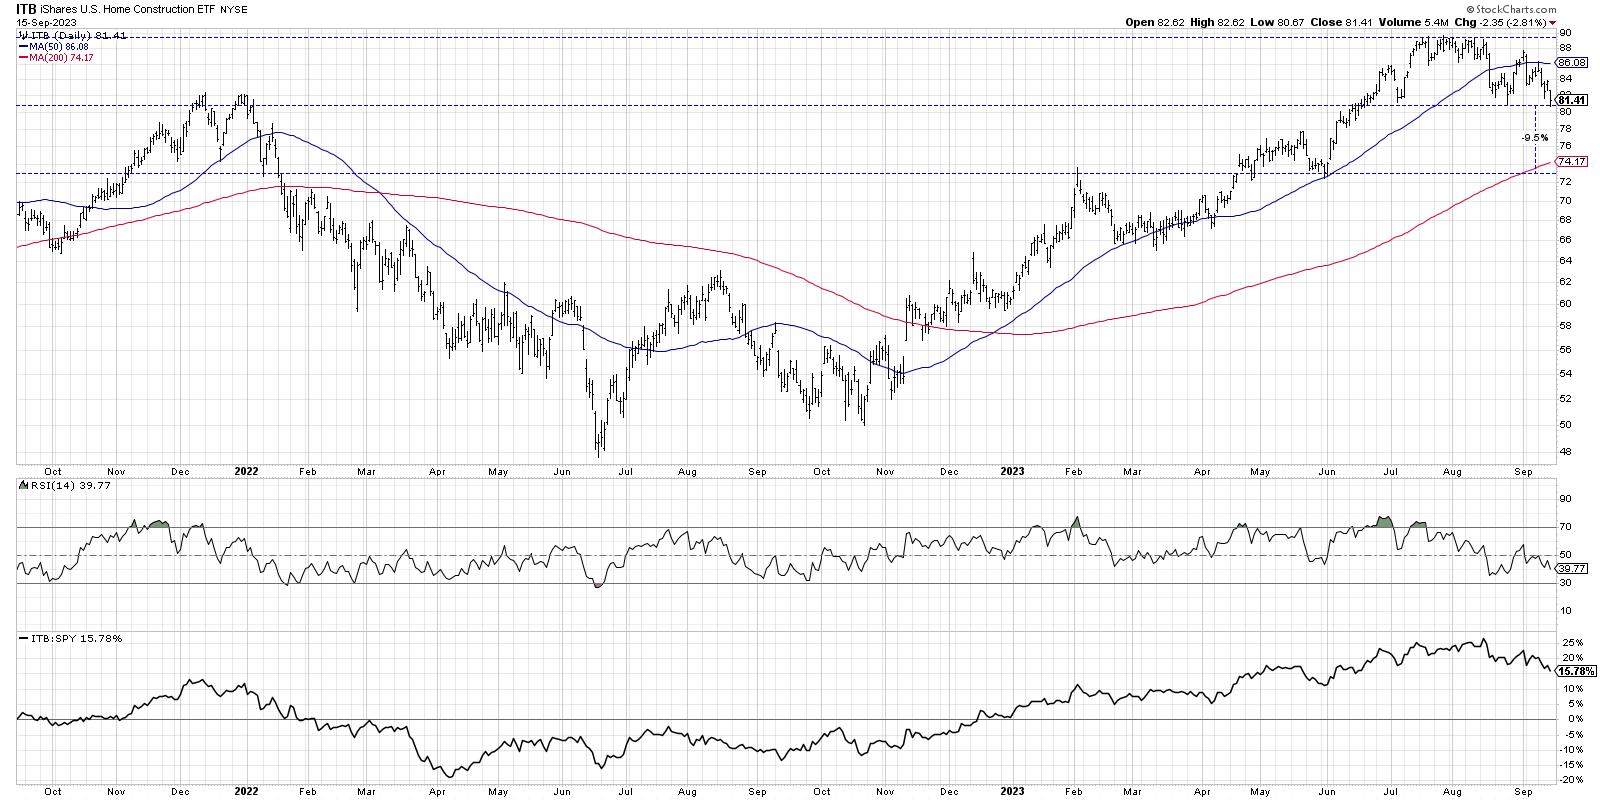
Note the high prices in July and August, where the ITB tested the same resistance level around $89 many times over a four-week period. Then, around the Labor Day holiday, we see a new lower high around $88. Similar to semiconductors, this leading group began to show signs of deterioration, as the uptrend had stalled out.
The relative strength line, which had been trending higher since November 2022, has now turned lower. This indicates that the industry group is underperforming the S&P 500, and also suggests that institutional investors are rotating their assets to other opportunities, like Energy stocks.
We can identify price support around $81 from lows in July and August. This level was reached once again this week, with Friday's drop once again pushing price down to potential support. If we see a break below $80, that would complete a breakdown pattern, with the height of the pattern indicating a minimum downside objective around $73.
Bonds (AGG)
This last chart is different than the others, in that it has been in a confirmed downtrend for some time now. The iShares Core U.S. Aggregate Bond ETF (AGG) is based off a popular bond market index and combines Treasury bonds and corporate bonds into one ETF.
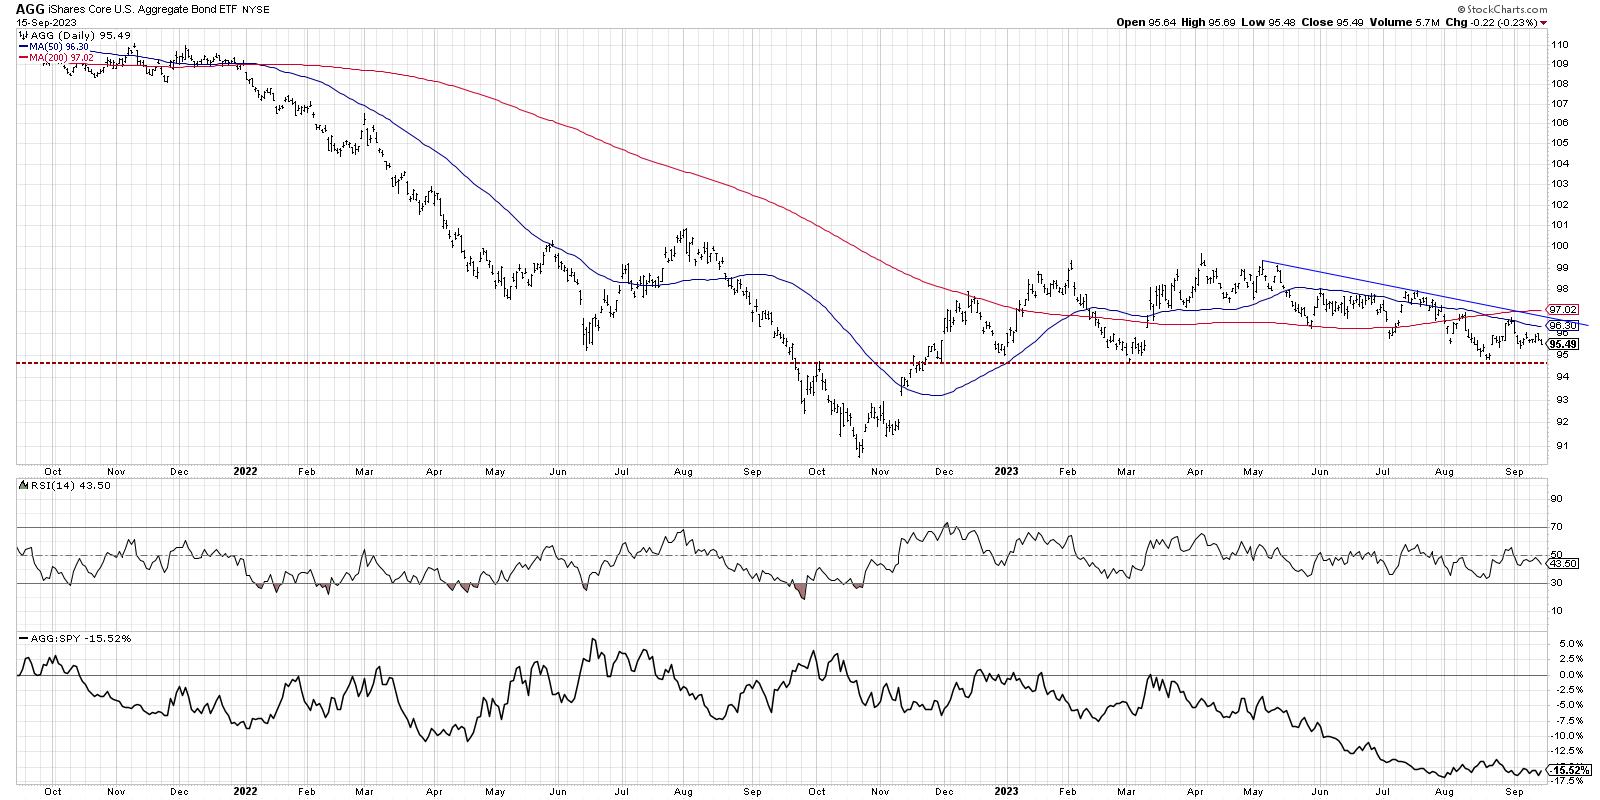
While the Nasdaq 100 and S&P 500 indexes broke above their February 2023 highs in April and May, respectively, AGG never was able to accomplish this breakout. A trendline using the highs since May show a fairly steady downtrend in bond prices, leading to a key support level around $94.50.
Note how the RSI has remained below 60 during this period as well. In bearish market phases, the entire range of a momentum indicator often moves lower. As long as the RSI remains below 60 on price bounces, it would suggest that this downtrend in bond prices is very much intact.
Why would lower bond prices suggest further downside for equities? A quick look at the Ten-Year Treasury Yield shows how higher rates are often not an ideal environment for growth stocks.
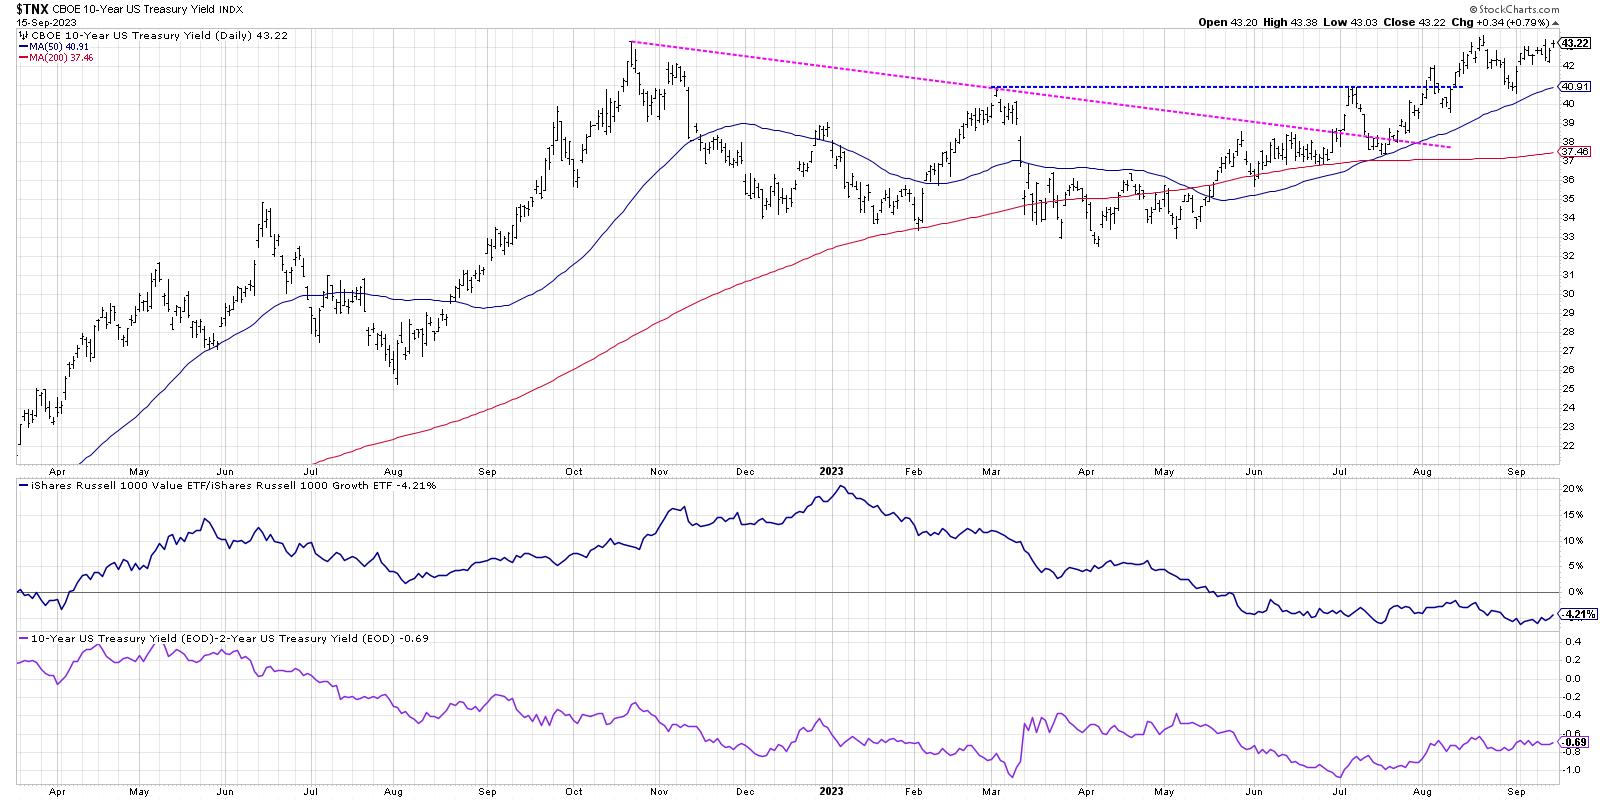
Lower bond prices mean higher bond yields. And higher interest rates are a headwind for growth stocks, as the value proposition for growth stocks is the potential for future earnings growth. If interest rates are going higher, that means that the future earnings of growth companies are worth less today.
As the panel just below the Ten-Year Yield shows, growth stocks have been holding steady with value stocks despite this rising rate environment. But if bond yields keep trending higher, this would put more and more pressure on growth stocks. which in turns means more potential downside for our growth-oriented benchmarks like the Nasdaq 100 and the S&P 500.
The S&P 500 has not yet confirmed a head-and-shoulders topping pattern. But given the weak trends in these three key ETFs, it appears that a breakdown for the S&P is much more likely than investors may expect!
RR#6,
Dave
P.S. Ready to upgrade your investment process? Check out my free behavioral investing course!
David Keller, CMT
Chief Market Strategist
StockCharts.com
Disclaimer: This blog is for educational purposes only and should not be construed as financial advice. The ideas and strategies should never be used without first assessing your own personal and financial situation, or without consulting a financial professional.
The author does not have a position in mentioned securities at the time of publication. Any opinions expressed herein are solely those of the author and do not in any way represent the views or opinions of any other person or entity.
