TAKEAWAYS
- Top investors use probabilistic analysis to think through different scenarios to determine which appears the most likely.
- By thinking through each of four potential future paths for the S&P 500, we can be better prepared for whichever scenario actually plays out in the coming weeks.
We are now in the seasonally weakest part of the calendar year. The summer doldrums often lead to a meaningful pullback in the third quarter, and 2023 has, so far, not disappointed by following the seasonal tendencies quite well.
The month of August saw leading names like Apple (AAPL) and Microsoft (MSFT) pull back from new highs, causing many investors to rethink the "2023 is going to go up all year" thesis. So now that we've experienced an initial drop, what's next for the S&P 500?
Today we'll revisit the concept of "probabilistic analysis", where we lay out four different potential scenarios for the S&P 500. There are three things I hope you take away from this exercise.
- It's important to have a thesis as to what you think will come next for stocks. This should be based on a meaningful combination of four key pillars: fundamental, technical, macroeconomic, and behavioral. And your portfolio should be positioned to reflect what you see as the most likely outcome.
- It's also important to consider alternative scenarios. What if the market is way more bullish than you'd expect? What if some five-standard-deviation event pops up, and stocks suddenly drop 20 percent? The best way to break out of your predetermined biases is to actively consider alternative points of view.
- It's incredibly important to think about how you would adapt to one of those alternate scenarios. How would your portfolio perform in a risk-off environment in the coming months? Are you prepared for a sudden spike in risk assets, and at what point would you need to change your positions to match this new reality?
I have found that the most successful investors don't know all the answers, but they ask the best questions. So let's broaden our horizons a bit, and consider four potential future paths for the S&P 500 over the next six to eight weeks. But first, we'll review the recent pullback for the major equity averages.
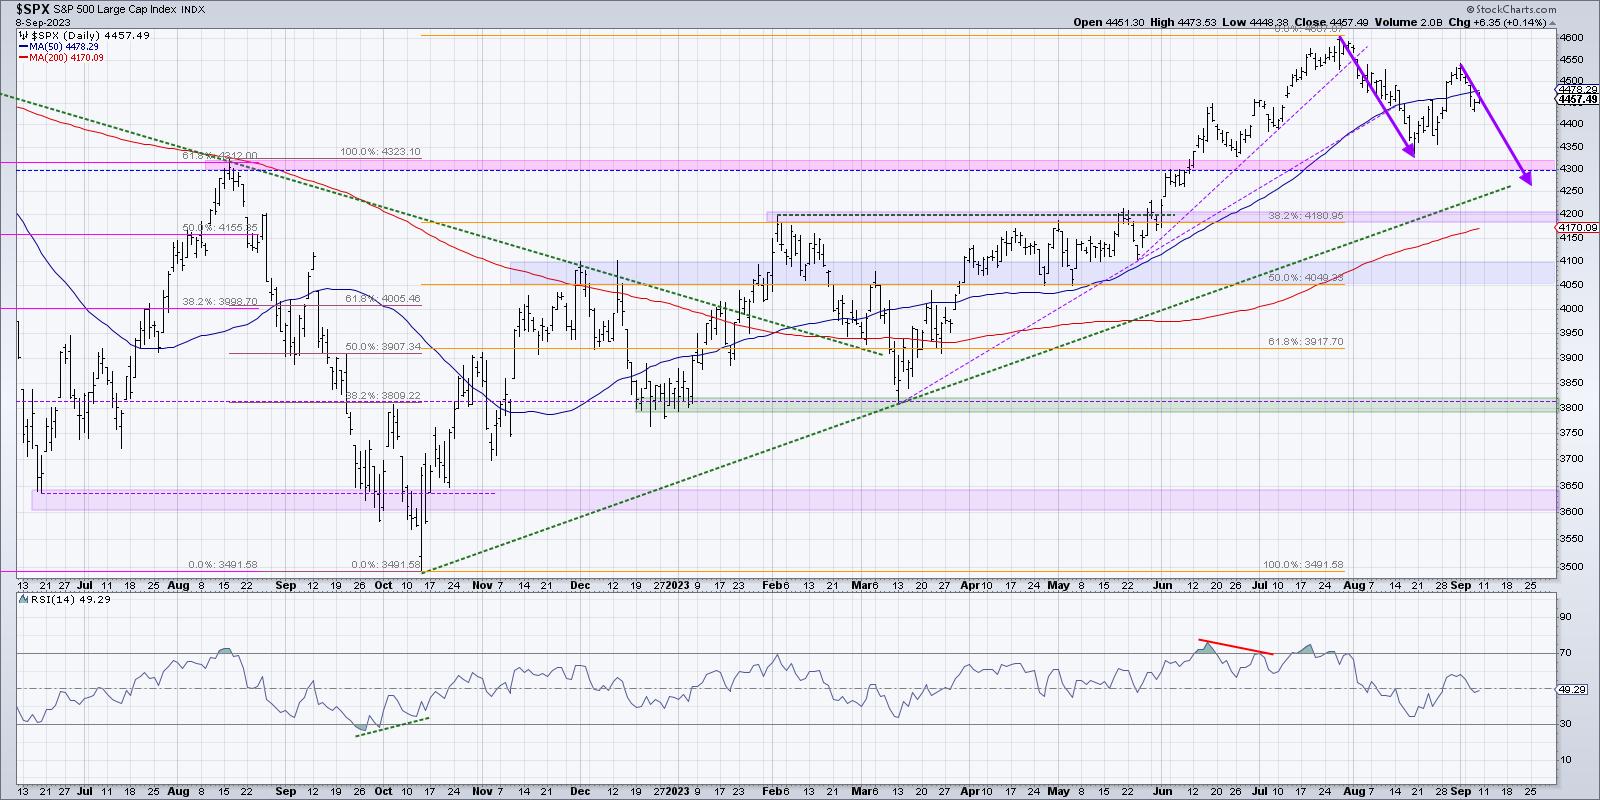
A brief seasonality check on the S&P 500 will show that August and September tend to be quite weak for the main US equity benchmark. So the drop we saw in early August actually follows the seasonal playbook quite well, as would further weakness in September.
We've been thinking about the possibility of a much deeper correction for risk assets, and it's a distinct possibility that we're now in an A-B-C pullback, which would take us to a new swing low right around options expiration in the third week of September. But at the same time that charts like LVS are displaying classic topping patterns, we can't help but notice that stocks like Alphabet (GOOGL) appear to be firmly entrenched in a protracted bullish phase.
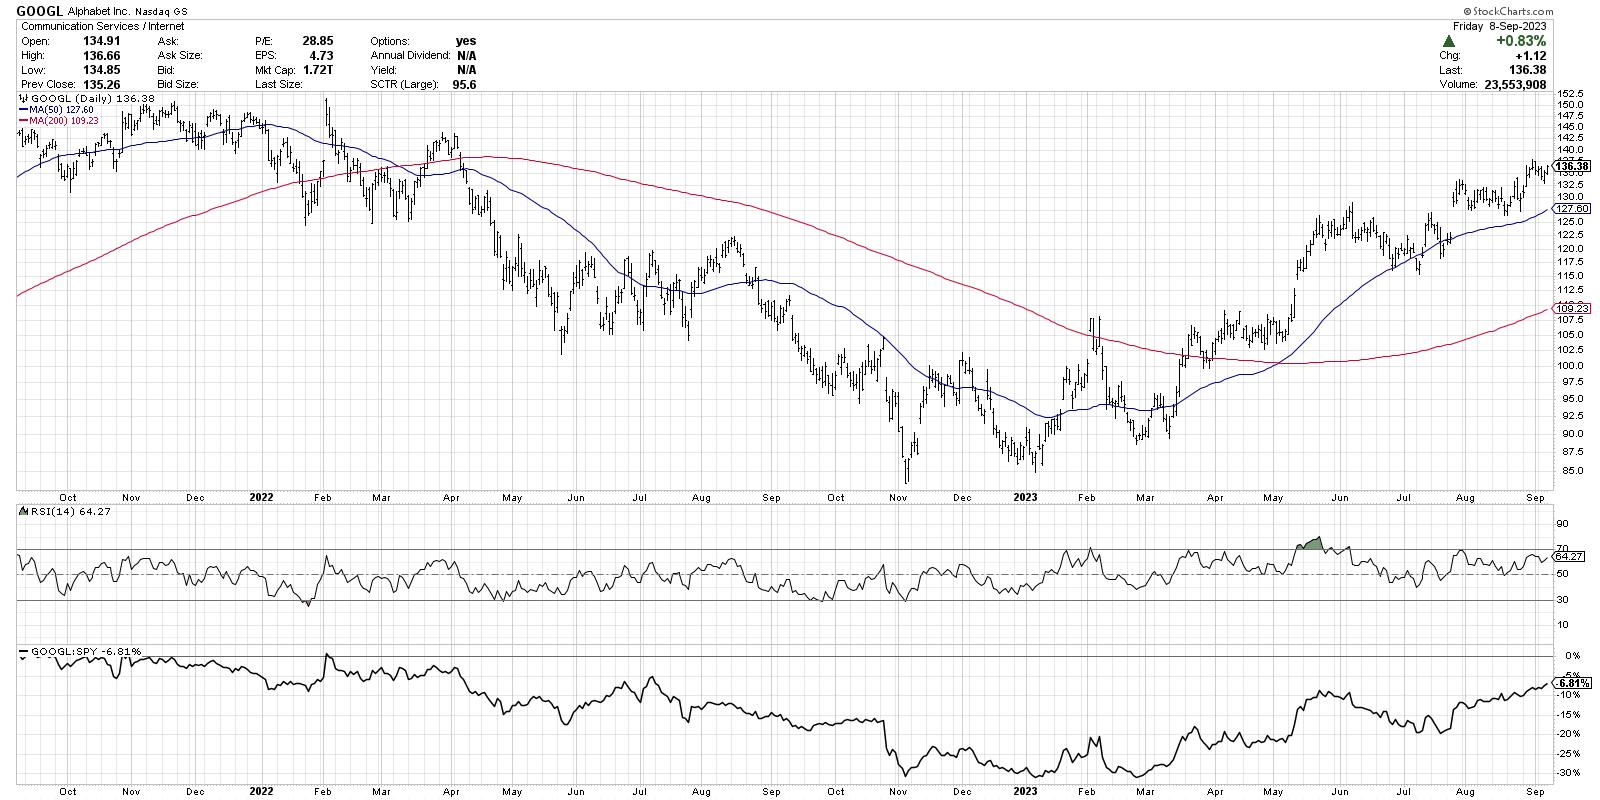
An uptrend is defined by a persistent pattern of higher highs and higher lows, and GOOGL certainly seems to be displaying that classic bullish phase quite well. How bearish do you want to be when Alphabet is just pounding higher month after month?
With our benchmarks pulling back and breadth conditions deteriorating, as well as key growth stocks like GOOGL still holding above support, let's lay out four potential scenarios for the S&P 500 over the next six-to-eight weeks. And remember the point of this exercise is threefold:
- Consider all four potential future paths for the index, think about what would cause each scenario to unfold in terms of the macro drivers, and review what signals/patterns/indicators would confirm the scenario.
- Decide which scenario you feel is most likely, and why you think that's the case. Don't forget to drop me a comment and let me know your vote!
- Think about each of the four scenarios would impact your current portfolio. How would you manage risk in each case? How and when would you take action to adapt to this new reality?
Let's start with the most optimistic scenario, involving a strong summer push for stocks.
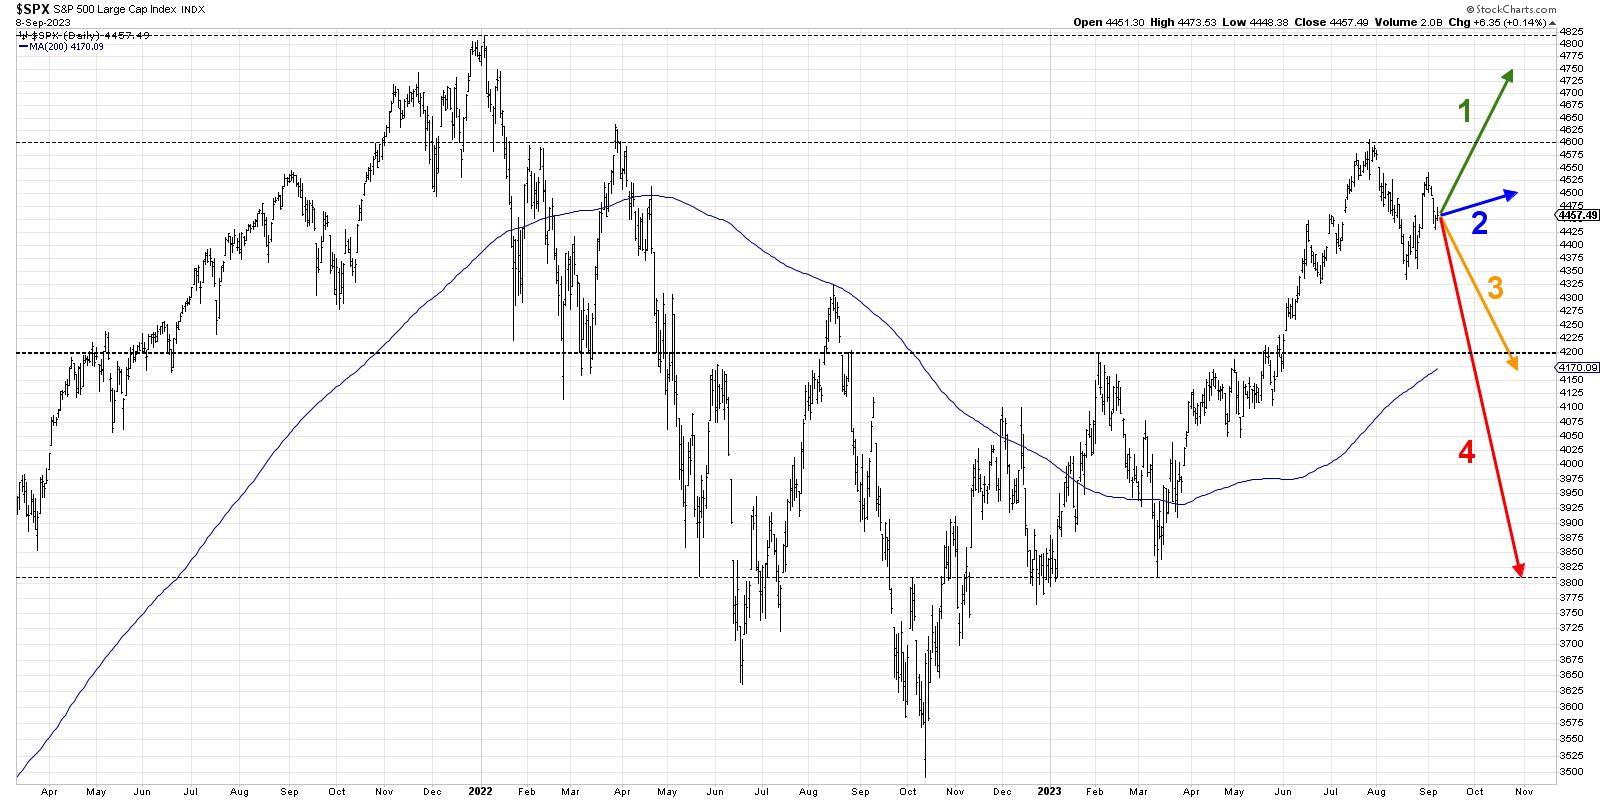
Scenario #1: The Very Bullish Scenario
What if the pullback of the next five weeks is over, and the market goes right back to a full risk-on mode? Stocks like AAPL and MSFT would most likely return back to test new highs and interest rates would probably come down enough, as economic data continues to show at the Fed's efforts have successfully slowed down the economy.
This Very Bullish Scenario would mean a break above 4600, and when we revisit the chart in late September, we're talking about the possibility of new all-time highs for the S&P 500 and Nasdaq in October.
Scenario #2: The Mildly Bullish Scenario
Markets can correct in two ways: price and time. A price correction (see February 2023) involves the chart moving lower quickly as the market quickly sheds value. A time correction (see April-May 2023) means there's not much of a price drop, and the "correction" is more of a pause of the uptrend.
There's a possibility that the July high around 4600 still holds as resistance, and a time correction keeps the S&P 500 in the 4300-4600 range. Keep in mind that there are plenty of opportunities for sectors like Energy to thrive in a sideways market, but the major indexes don't make any headway in either direction.
Scenario #3: The Mildly Bearish Scenario
What if the A-B-C correction outlined above plays out, and the S&P 500 index pushes lower to retest the 200-day moving average? If interest rates remain elevated, and growth stocks continue to pull back, this would be a very reasonable outcome for the equity markets.
One of my mentors used to say, "Nothing good happens below the 200-day moving average." The good news is the Mildly Bearish Scenario means we drop further from current levels, but still manage to find support at this important long-term barometer.
Scenario #4: The Super Bearish Scenario
This is where things could get really nasty. What if the market goes full risk-off, interest rates push higher, economic data comes in hotter than expected, and the Fed is forced to consider further rate hikes instead of debating when to ease monetary conditions?
This Super Bearish Scenario would mean the S&P 500 breaks down through 4300 and 4200, leaving the 200-day moving average in the rearview mirror, and in late September we're debating whether the S&P 500 and Nasdaq will make a new low before year-end 2023.
Have you decided which of these four potential scenarios is most likely based on your analysis? Head over to my YouTube channel and drop a comment with your vote and why you see that as the most likely outcome.
Also, we did a similar analysis back on the S&P 500 back in June. The "mildly bullish" scenario ending up matching the market action pretty closely. Which scenario did you vote for?
Only by expanding our thinking through probabilistic analysis can we be best prepared for whatever the future may hold!
RR#6,
Dave
P.S. Ready to upgrade your investment process? Check out my free behavioral investing course!
David Keller, CMT
Chief Market Strategist
StockCharts.com
Disclaimer: This blog is for educational purposes only and should not be construed as financial advice. The ideas and strategies should never be used without first assessing your own personal and financial situation, or without consulting a financial professional.
The author does not have a position in mentioned securities at the time of publication. Any opinions expressed herein are solely those of the author and do not in any way represent the views or opinions of any other person or entity.


