TAKEAWAYS
- Value sectors have been consistently underperforming the benchmarks since the April market low
- Technology has outperformed the S&P 500 as well as other growth sectors in 2024
- Defensive sectors like Utilities and Consumer Staples may be the most important to watch, as they can demonstrate investor uncertainty
A thorough analysis of seasonal trends for the S&P 500 over the last 12 years provides two key takeaways: there is usually a major market top in the summer, and there is often a major market low in the fall. So, on top of simply analyzing the chart of the S&P 500, what else can we do to anticipate and validate a potential market top?
I would suggest that sector rotation could be key here, because the current uptrend is being driven by a very small number of sectors (actually just one, to be completely honest). Any adjustment to that configuration would constitute a "change of character" for this market, and most likely coincide with the summer market top many are expecting.
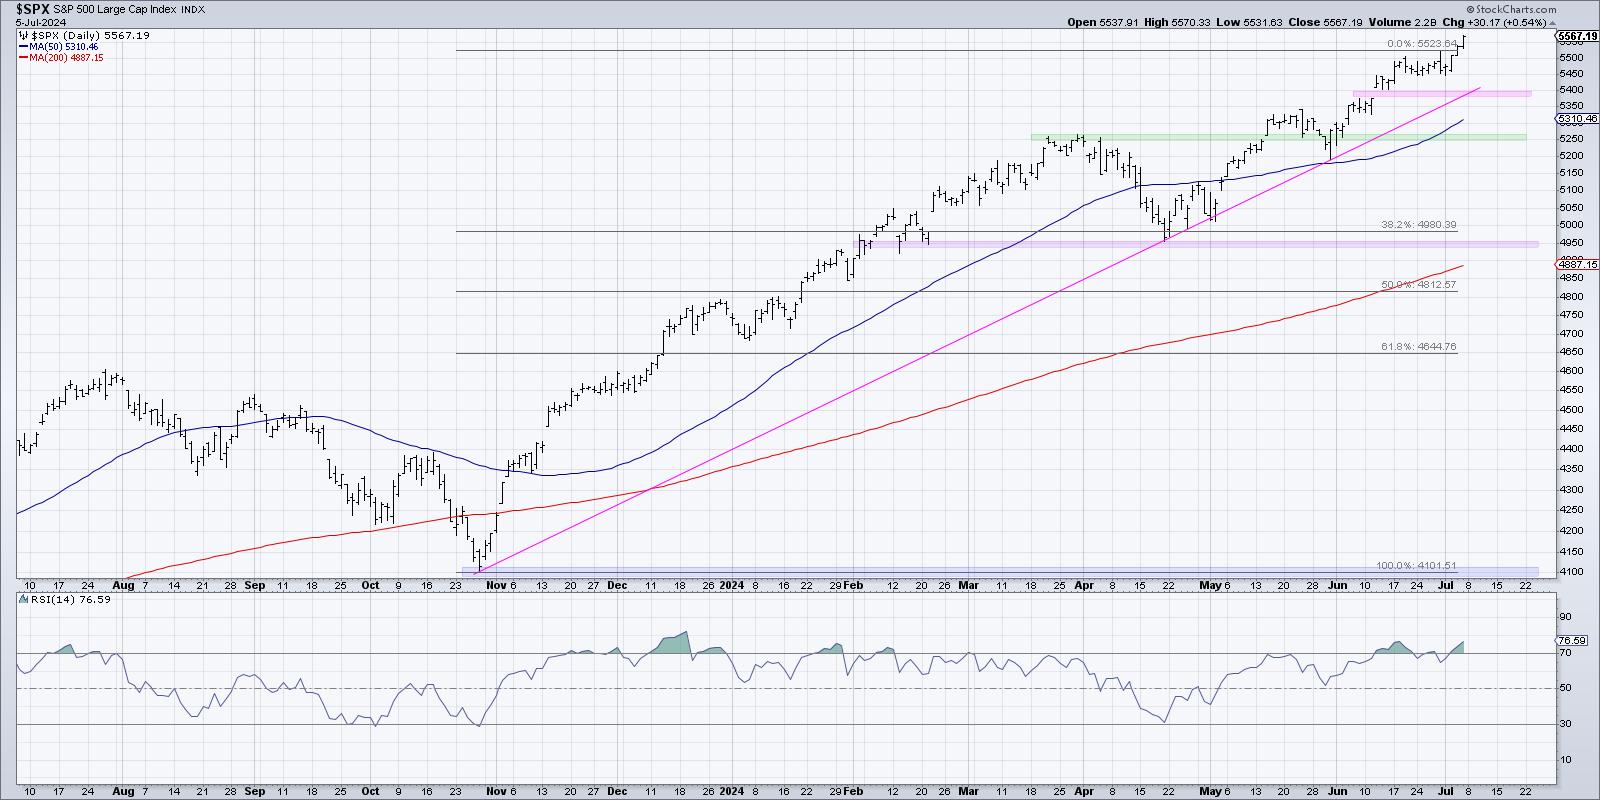
While the daily chart of the S&P 500 appears fairly consistent in 2024, aside from a two-week drop in early April, we have to remember that this market had a very different complexion before and after that market low. Before the April pullback, this was a broad advance, with most sectors thriving as the "everything rally" propelled the equity benchmarks higher. In May and June, and now into July, this has been more of a narrow rally, with a small number of mega-cap growth stocks thriving while most stocks have struggled.
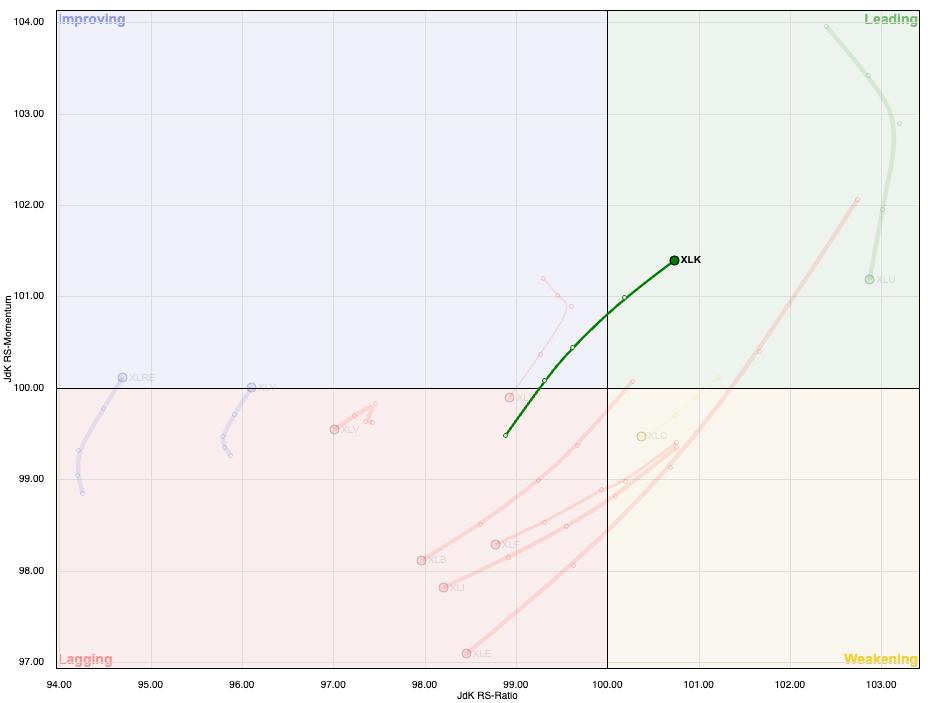
I love the simplicity of the RRG graph in visualizing the rotation of the 11 S&P 500 sectors. The weekly RRG shows that it's clearly been "the technology show" for weeks, as the XLK is the only sector in the Leading quadrant and moving up and to the right. Now, let's take a deeper look at the relative performance of the S&P 500 sectors in three buckets: growth leadership, value leadership, and defensive sectors.
Defensive sector performance is one of the seven items on my Market Top Checklist. Want to see the other six, and get help navigating a potential summer market top? Check out our Market Misbehavior premium membership and use code STOCKCHARTS for 20% off your first 12 months!
Value Sectors Thrived in Q1, Struggled in Q2
In this series of charts, each line represents a simple ratio of the performance of one sector versus the S&P 500 index. If the line is going up, that means the sector has been outperforming. If the line is trending lower, that means the sector underperformed during that period.
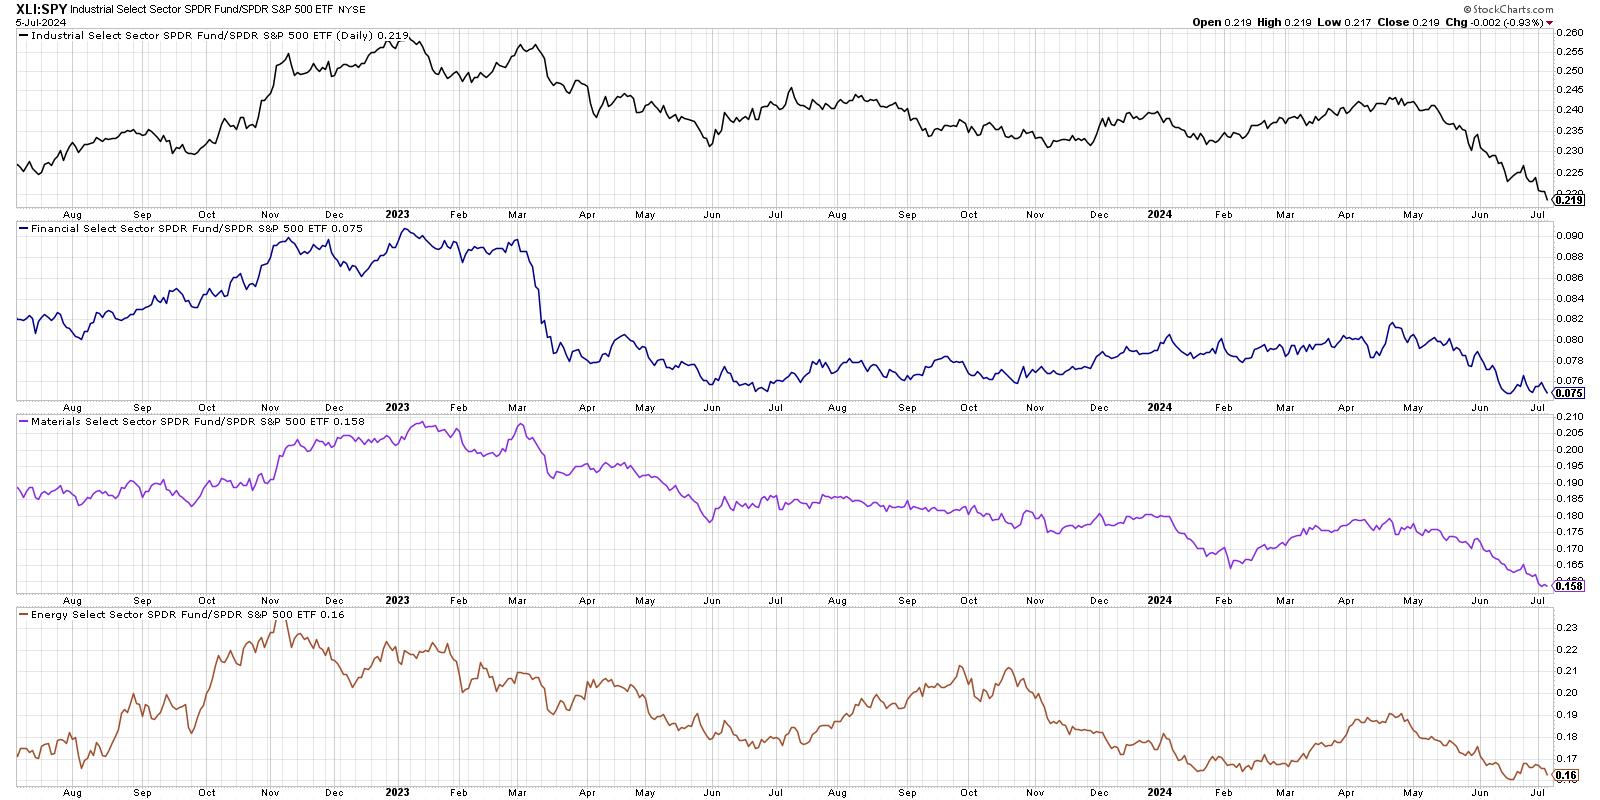
We can see here that the Industrial, Financial, Materials, and Energy sectors have all underperformed the SPX since the April market low. While these sectors all were outperforming in Q1, all four of them are at or near new relative lows as we enter Q3. While the S&P 500 and Nasdaq have been pushing higher, these sectors have not been a part of that success story!
Technology is the Only Sector with Strong Relative Strength
From mid-April to early July, only one of the S&P 500 sectors has actually managed to outperform the benchmark in a meaningful way, that being Technology. While the Consumer Discretionary sector has popped higher in recent weeks driven by AMZN and TSLA, and Communication Services has basically performed in line with the S&P 500, Technology has had the strongest run of relative performance.
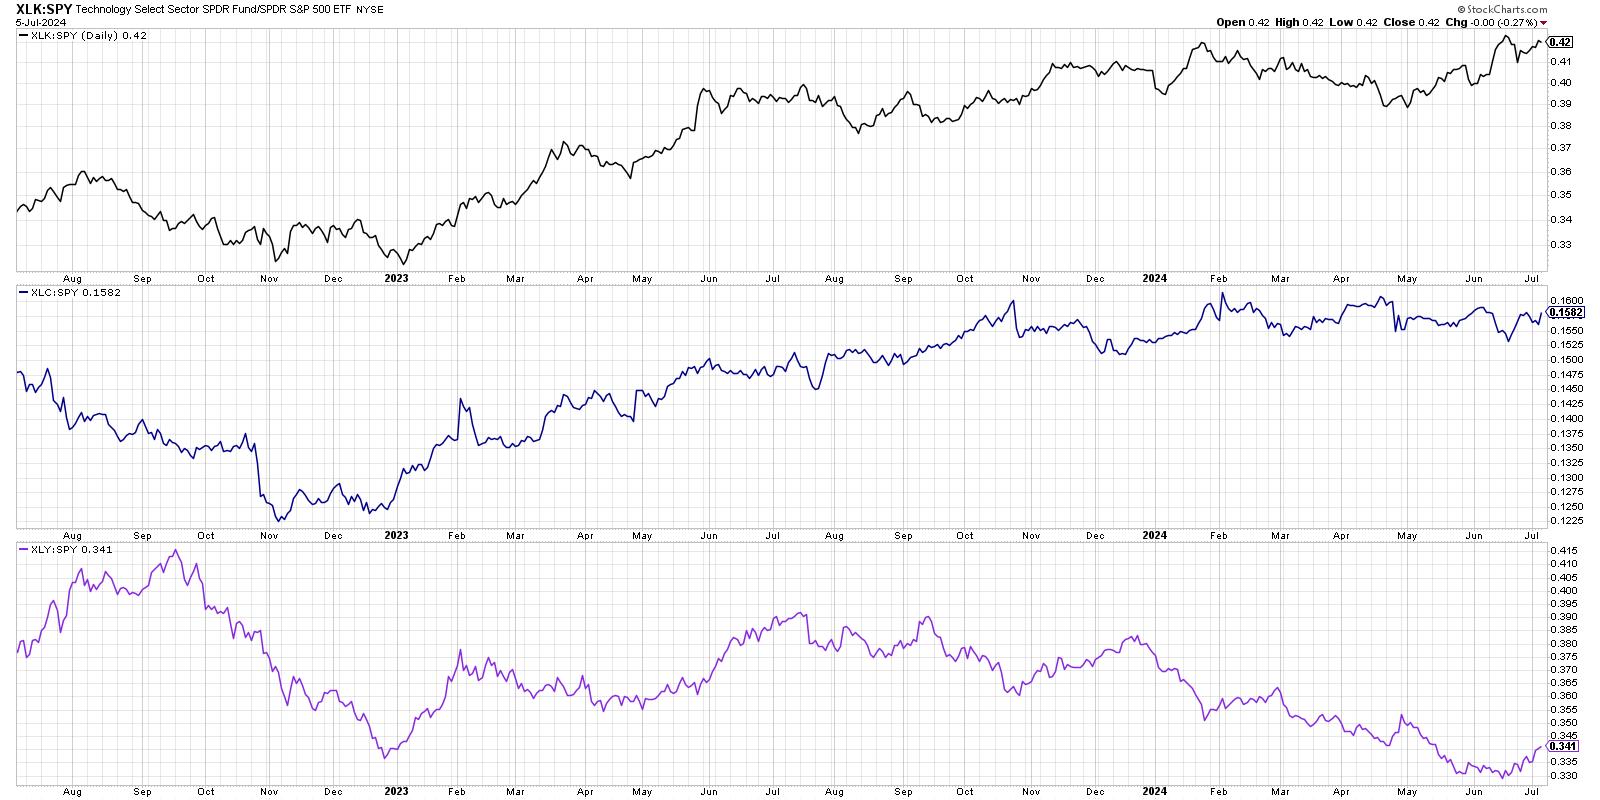
Given the dominance of the AI trade in 2024, it's no surprise how Technology is clear outlier in terms of relative performance. And if there's one thing I've learned from a career as a technical analyst, it's to stick with winning trades as long as they keep winning!
Defensive Sectors May Be the Most Important to Watch
So that leaves us with three defensive sectors which don't tend to attract flows unless investors are afraid to own anything else. And all three have underperformed over the last 12 months, reinforcing the bullish sentiment still evident in the stock market.
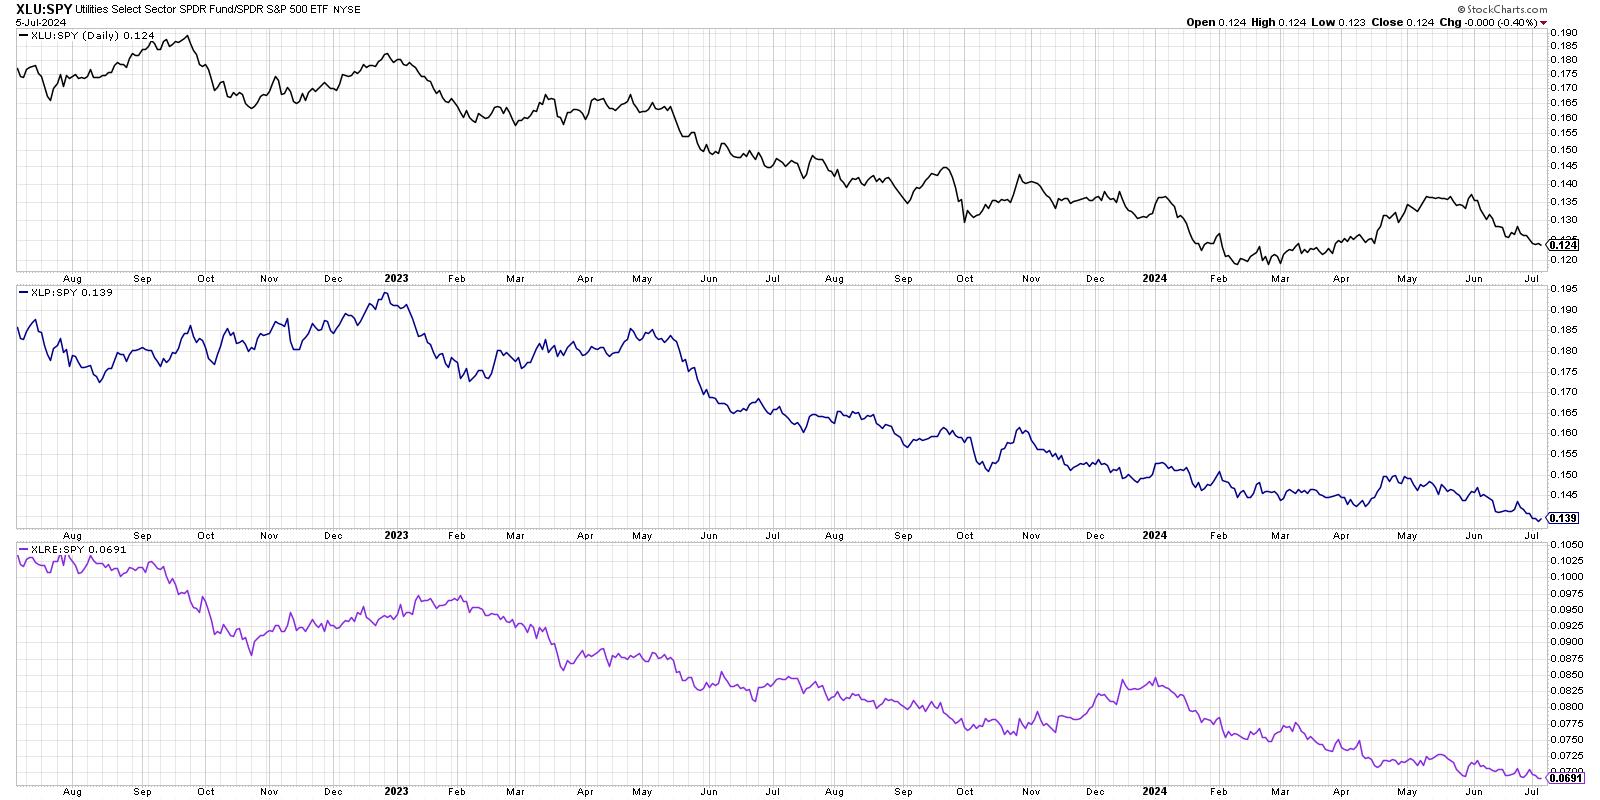
Utilities stocks had a brief rally in April and May, during a period when most of their earnings calls were focused on power needs for artificial intelligence. But it didn't take long for that short-term phase to end, and Utilities once again lagged behind the major equity benchmarks.
This chart is one that I feature on my Market Top Checklist, because improvement in the relative strength of defensive sectors suggests that institutional investors are trying to hide out during a period of market uncertainty. And while these three sectors have occasionally outperformed during a bull market phase, their relative lines usually only turn higher during a bear market environment.
For now, the sector relative charts tell the story of a narrow market advance driven by Technology. I would argue that this same set of charts can tell you much of what you need to know to navigate a potential leadership rotation and even a likely market top in the summer months of 2024!
RR#6,
Dave
P.S. Ready to upgrade your investment process? Check out my free behavioral investing course!
David Keller, CMT
Chief Market Strategist
StockCharts.com
Disclaimer: This blog is for educational purposes only and should not be construed as financial advice. The ideas and strategies should never be used without first assessing your own personal and financial situation, or without consulting a financial professional.
The author does not have a position in mentioned securities at the time of publication. Any opinions expressed herein are solely those of the author and do not in any way represent the views or opinions of any other person or entity.


