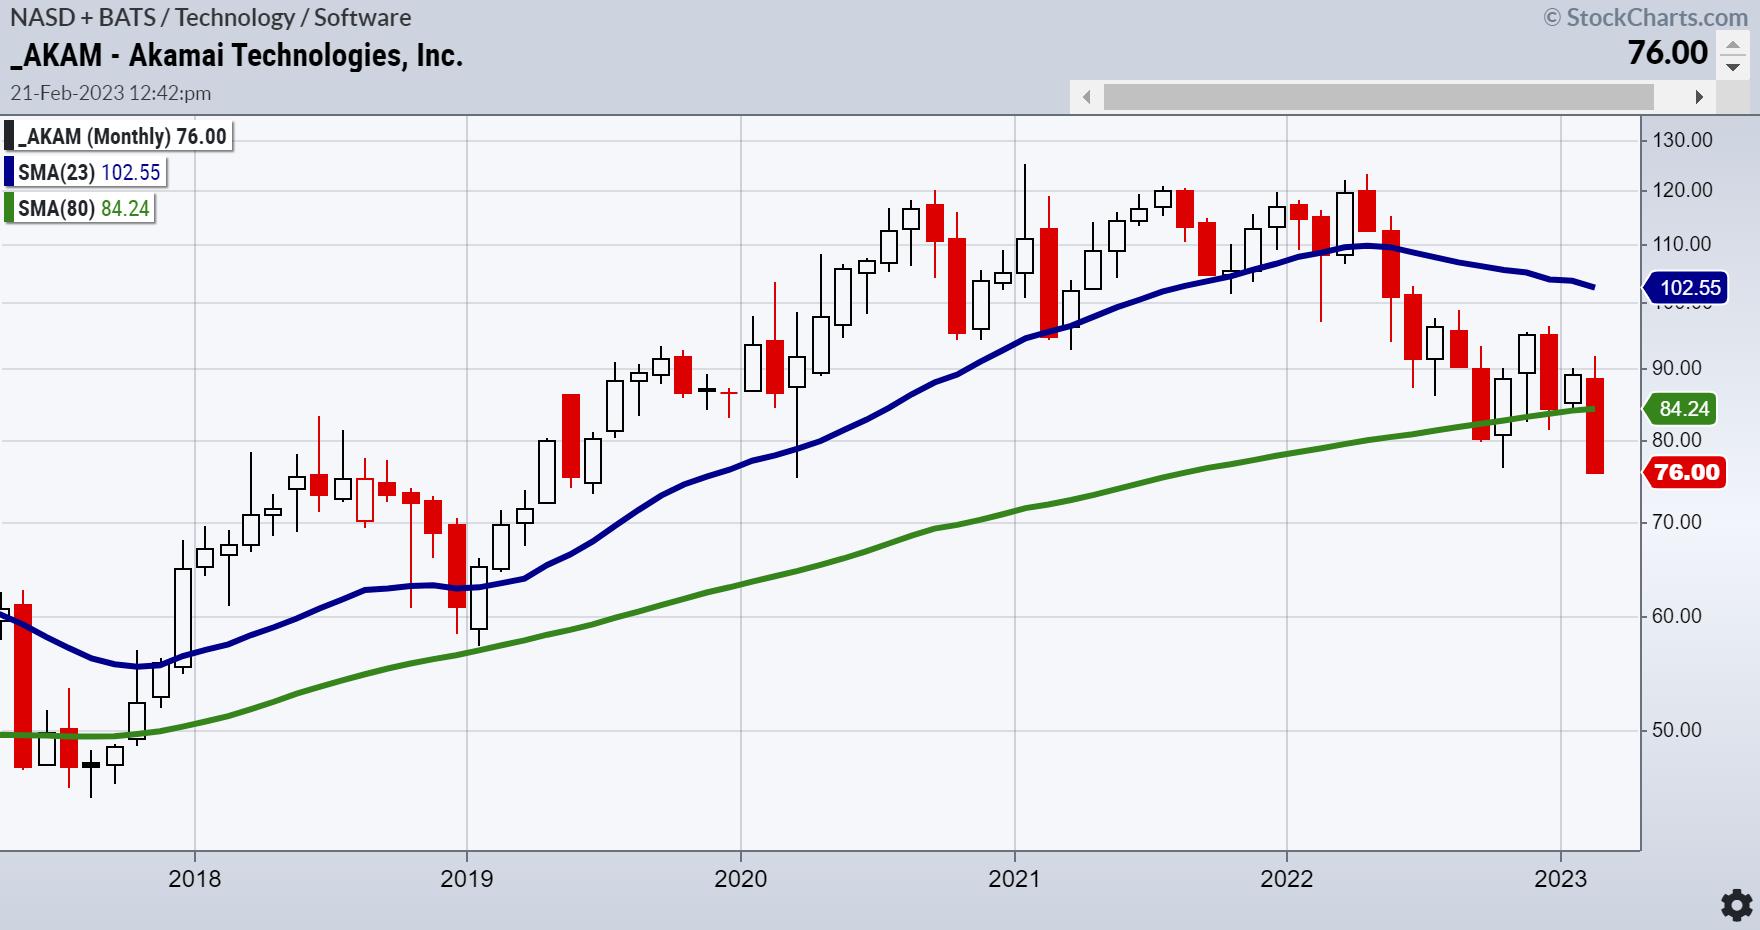
CHART 1: MONTHLY CHART OF AKAM STOCK. AKAM has broken below its two-year business cycle. Is a reversal in the cards? Chart source: StockChartsACP. For educational purposes only.
Akamai Technologies (AKAM) is a cloud computing company in the tech sector that deals with online security. Up until mid-2022, the trend was up.
Then, with the hawkish Fed, the trend changed, with AKAM eventually breaking the 23-month or two-year business cycle in May 2022. It just goes to show you how many companies prospered in a low interest rate-corporate buy back environment, until ...
The recent earnings report was decent. US revenue for the fourth quarter was $483 million, up 1% year-over-year. US revenue for 2022 was $1.902 billion, up 4% year-over-year. Nonetheless, tech in general will have a hard time in the new paradigm of higher interest rates, apparently for longer.
The monthly chart shows a clean breakdown under the 80-month moving average. This is a six to seven year business cycle. Our interpretation is that this stock will act more inline with the potential oncoming recession or stagflation environment.
How did we find this stock, and what does the daily chart look like?
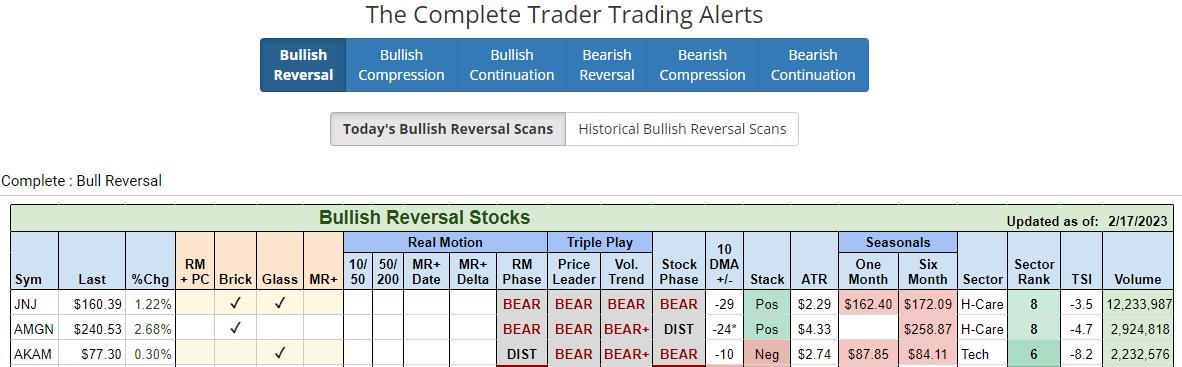
This scan is from our Complete Trader product. This scan is from last Friday. It showed a bullish reversal pattern in the form of a glass bottom. However, the Real Motion phase is Distribution (50 over the 200-DMA but price momentum below both MAs).
The stock's phase is bearish so the reversal intrigued us a possible low risk buy—and then the market declined to start off the shortened week.
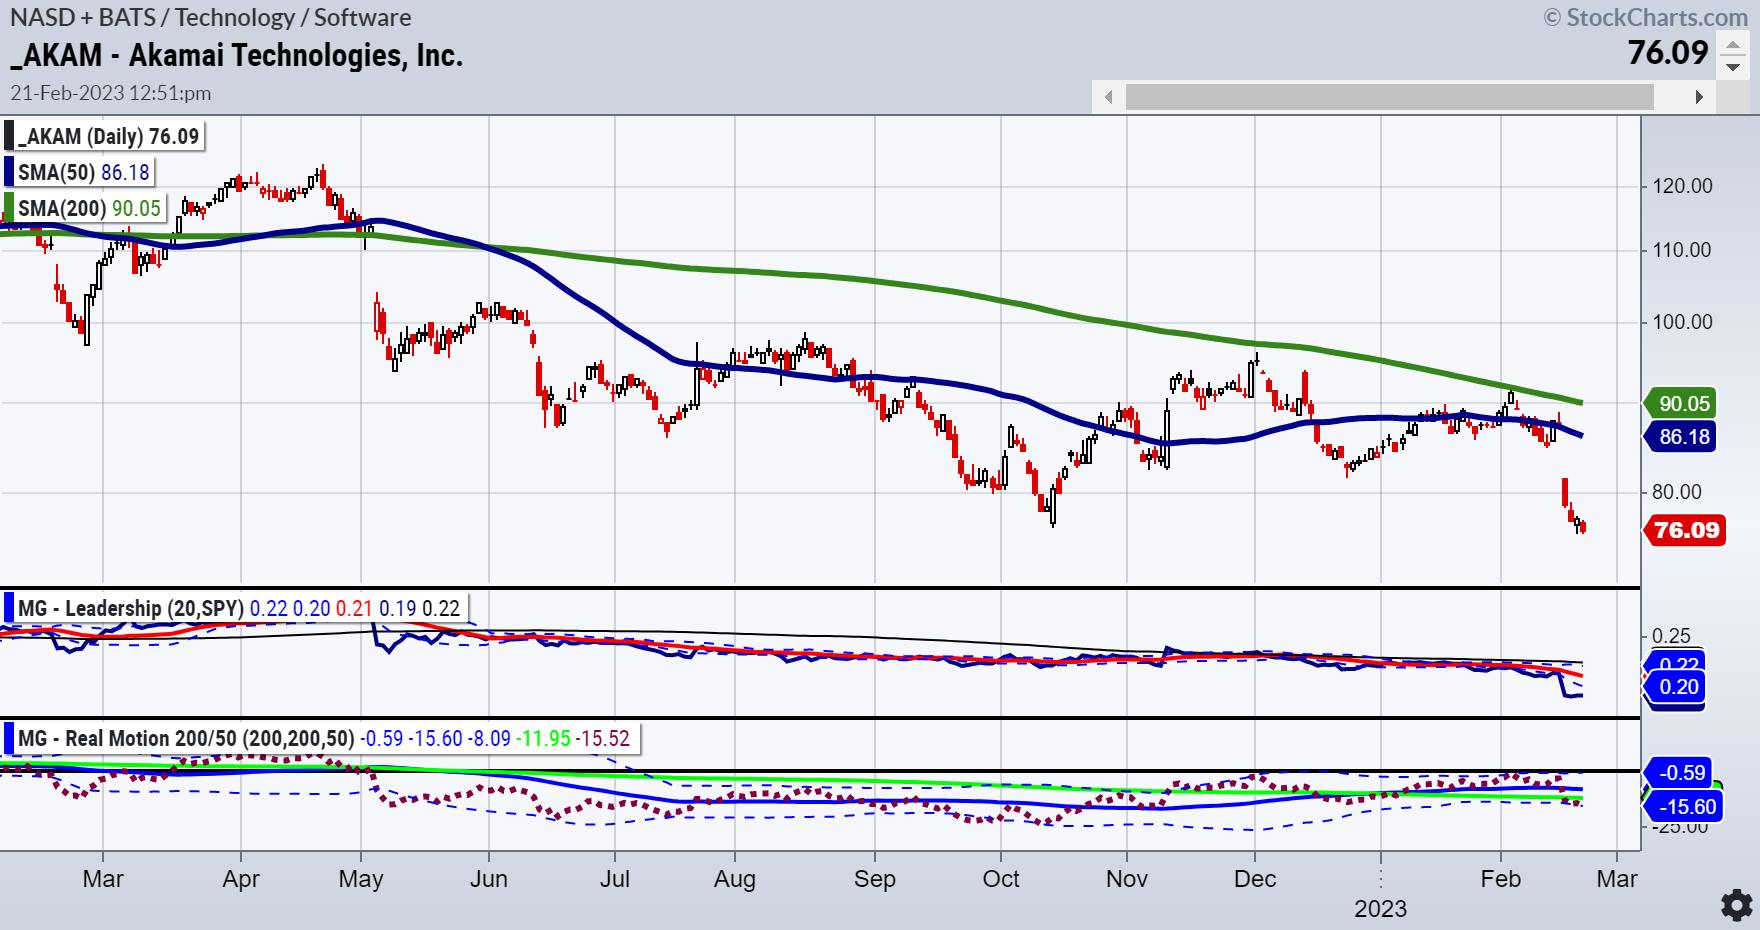
CHART 2: DAILY CHART OF AKAM. If AKAM's stock price moves above Friday's high, it could be a setup for a potential buying opportunity. But, if AKAM goes below Friday's high, it could make another leg lower. Chart source: StockChartsACP. For educational purposes only.
So, we checked the daily chart. At MarketGauge, we have lots of tools and scanners, as well as trading models and blends, that help you find stocks set up to trade.
Real Motion (our momentum indicator) broke the Bollinger Band®, which confirms the weakness of the entire Tech sector. On Leadership, AKAM is well underperforming the benchmark. Perhaps the most interesting part of the chart though, is that it had an inside day on Friday. That tells us one of two scenarios to follow:
- The glass bottom can become a brick wall or a two-day pattern and a move over Friday's high on Wednesday, is a good setup for a buy.
- AKAM takes out Friday's low and makes another leg lower.
How do you use the monthly chart? Feel bolder that the overall trend is down if the stock fails Friday's lows. Know that if you buy, it could be nothing more than a short-covering rally rather than a true bottom. Finally, watch for a mean reversion as the Bollinger Band on Real Motion can go either way.
Tech in general had an awful start to the week, with a FOMC announcement on the way. Akamai could just wind up not only as a decent trade, but also a barometer of the next direction of growth and tech stocks.
All this from our incredible Complete Trader scan!
For more detailed trading information about our blended models, tools and trader education courses, contact Rob Quinn, our Chief Strategy Consultant, to learn more.
IT'S NOT TOO LATE! Click here if you'd like a complimentary copy of Mish's 2023 Market Outlook E-Book in your inbox.


"I grew my money tree and so can you!" - Mish Schneider
Get your copy of Plant Your Money Tree: A Guide to Growing Your Wealth and a special bonus here.
Follow Mish on Twitter @marketminute for stock picks and more. Follow Mish on Instagram (mishschneider) for daily morning videos. To see updated media clips, click here.
Mish in the Media
Mish and Charles talk food inflation and the Metaverse on Making Money with Charles Payne!
See Mish present "Best Trade, Worst Trade, Next Trade" on Business First AM.
Mish shares insights on the US Dollar, euro, gold and natural gas in this appearance on CMC Markets.
Mish shares three charts she is using to measure inflation using the commodities markets on the Wednesday, February 14 edition of StockCharts TV's The Final Bar with David Keller!
Mish gives you some ideas of what might outperform in this new wave of inflation on the Friday, February 10 edition of StockCharts TV's Your Daily Five. She has picks from energy, construction, gold, defense, and raw materials.
Read about Mish's interview with Neils Christensen in this article from Kitco!
ETF Summary
- S&P 500 (SPY): Closer to the 390 support with 405 closest resistance.
- Russell 2000 (IWM): Heading to major weekly MA support around 184. 190 has to clear again.
- Dow (DIA): 326 support, 335 resistance.
- Nasdaq (QQQ): 300 the pivotal area, 290 major support. Those 2 inside weeks resolved to the downside. 284 big support, 300 resistance.
- Regional banks (KRE): 65.00 resistance, 61 support.
- Semiconductors (SMH): 228 bigger support and 240 resistance. 248 resistance, 237 then 229 support.
- Transportation (IYT): Landed on the 50-DMA so has to hold or more pain.
- Biotechnology (IBB): Under 130 now (pivotal)--even biotech feels the pinch.
- Retail (XRT): 66-68 huge area to hold if the market still has legs.
Mish Schneider
MarketGauge.com
Director of Trading Research and Education


