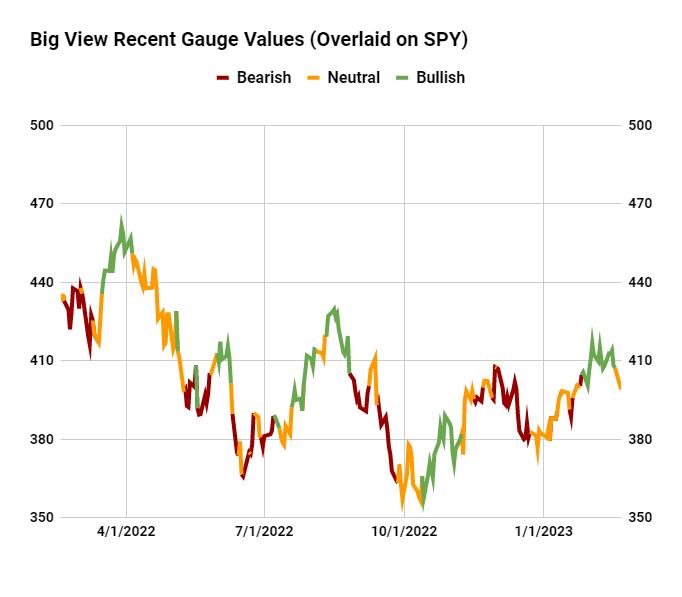
 The above chart is from our MarketGauge product called Big View.
Risk Sentiment
Coming into the FOMC, the sentiment for risk is neutral. A week ago sentiment was 100% bullish. A month ago, it was neutral leaning towards bearish. Amazingly, the sentiment and the persistent trading range in the S&P 500 index are aligned.
The S&P 500 failed the 23-month moving average or two-year business cycle, which, if it clears, signals a softer landing. Yet, it held the pivotal 3900 ahead of the Fed, signaling a no landing. And, by tomorrow, we will have to watch if the SPDR S&P 500 ETF (SPY) breaks below 3900, more of an indication of a hard landing. So a neutral sentiment while we wait is appropriate and speaks volumes about the smarter retail investor.
With so much speculation on "landings" for the economy, let's examine the definitions and implications.
- A "no landing" means that the economy still grows even though the Federal Reserve tries to lower inflation by continuing to rase interest rates.
- A "soft landing", or what many believe is the best scenario, would be if the Fed raises rates just enough to cool while the economy remains robust.
- A "hard landing" infers that the only way the Fed can control inflation is by raising the rates enough so that the result is the economy going into a big recession.
It seems to us, that the word "stagflation" is more appropriate. Stagflation is a period when slow economic growth and joblessness coincide with rising inflation.
The argument against this scenario is that joblessness, even with all the job cuts by large companies, has yet to take hold in the jobs numbers—at least for now. Also, gross domestic product (GDP) comes out this week. The expectations are for an annual rate expansion of 0.6% this quarter. That is up from previous calls for a 0.2% increase.
Clearly, the Fed minutes shed no new light. The consensus is to watch the upside risks for inflation, keep raising if need be, and, of course, be mindful of going too far to cause recession.
Retail Sector Overview
Looking at the weekly chart of SPDR S&P Retail ETF (XRT), it will be easier to gauge next steps.
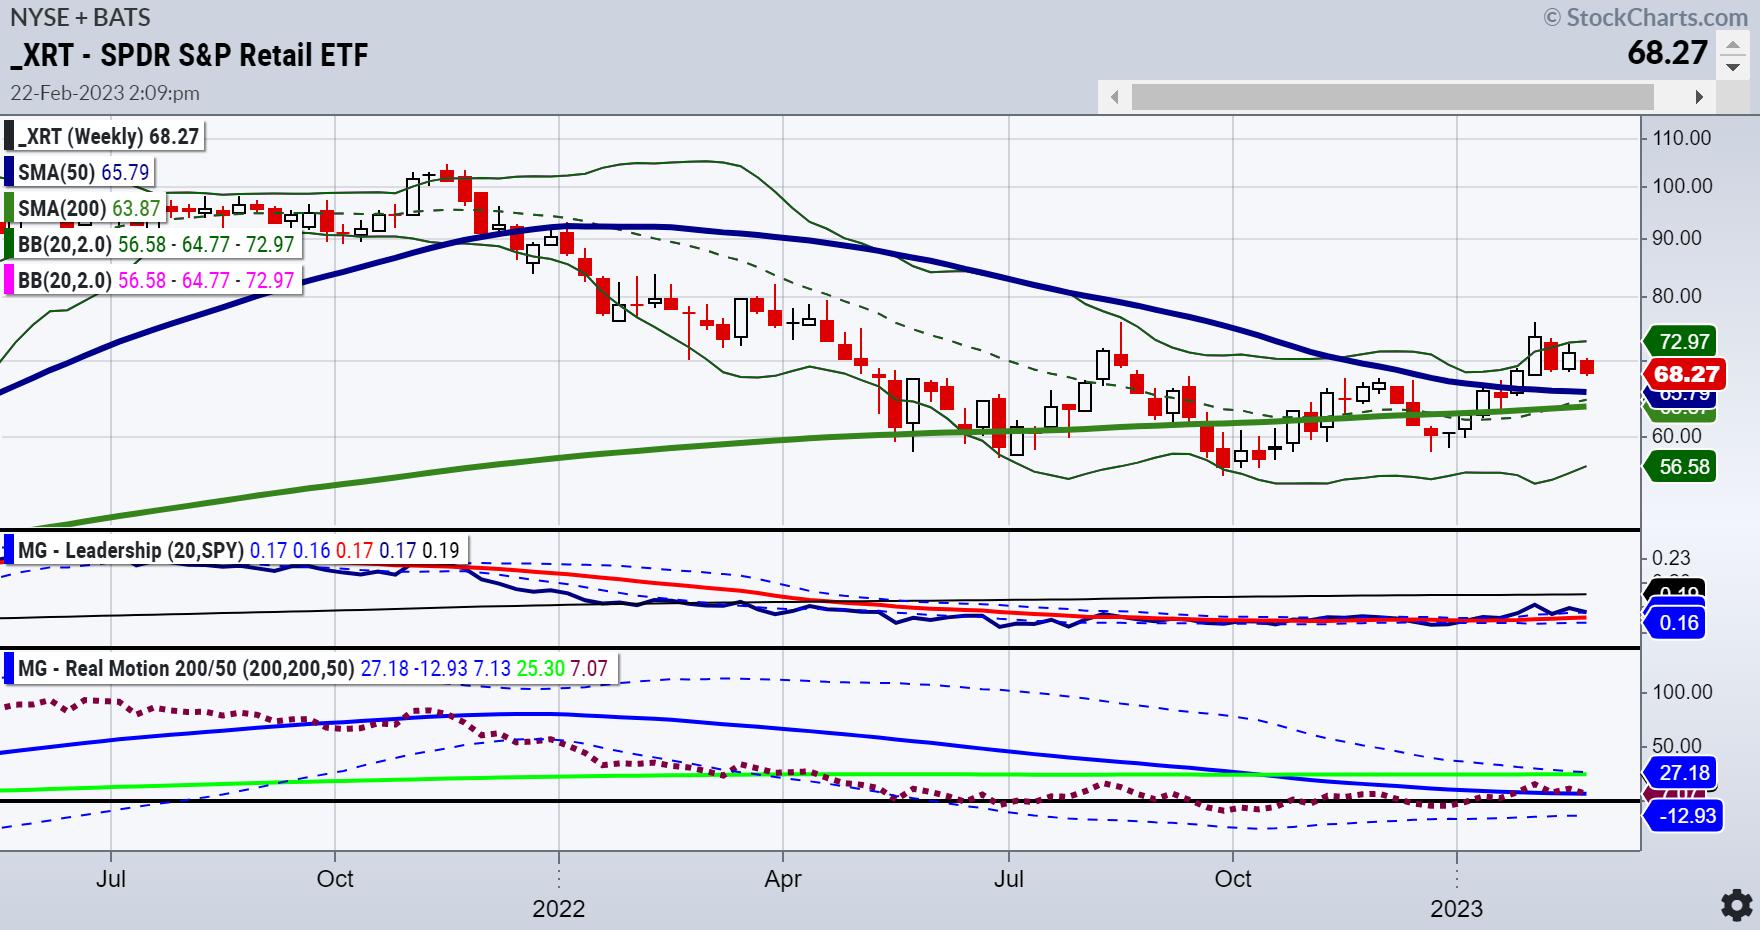
For starters, retail makes up 70% of the GDP. Consumers count. Secondly, XRT never cleared the two-year cycle high or 23-month moving average. Thirdly, it's in a bullish phase on the daily and weekly charts.
Next, the Real Motion momentum indicator shows declining momentum and a bearish phase on the weekly charts. The daily charts show a retracement to momentum support. XRT is indeed marginally outperforming the SPY on the weekly timeframe and underperforming on the daily timeframe. Hence, a neutral bias, and a bit more patience is needed to see if the consumer's confidence remains high or not.
From deflation to inflation to stagflation and beyond, our approach to 2023 is to consider each of those potential outcomes, weighing market expectations against the price.
For more detailed trading information about our blended models, tools and trader education courses, contact Rob Quinn, our Chief Strategy Consultant, to learn more.
IT'S NOT TOO LATE! Click here if you'd like a complimentary copy of Mish's 2023 Market Outlook E-Book in your inbox.


"I grew my money tree and so can you!" - Mish Schneider
Get your copy of Plant Your Money Tree: A Guide to Growing Your Wealth and a special bonus here.
Follow Mish on Twitter @marketminute for stock picks and more. Follow Mish on Instagram (mishschneider) for daily morning videos. To see updated media clips, click here.
Mish in the Media
Mish and Charles talk food inflation and the Metaverse on Making Money with Charles Payne!
See Mish present "Best Trade, Worst Trade, Next Trade" on Business First AM.
Mish shares insights on the US Dollar, euro, gold and natural gas in this appearance on CMC Markets.
Mish shares three charts she is using to measure inflation using the commodities markets on the Wednesday, February 14 edition of StockCharts TV's The Final Bar with David Keller!
Mish gives you some ideas of what might outperform in this new wave of inflation on the Friday, February 10 edition of StockCharts TV's Your Daily Five. She has picks from energy, construction, gold, defense, and raw materials.
Read about Mish's interview with Neils Christensen in this article from Kitco!
ETF Summary
- S&P 500 (SPY): 390 support with 405 closest resistance.
- Russell 2000 (IWM): MA support around 184. 190 has to clear again.
- Dow (DIA): 326 support, 335 resistance.
- Nasdaq (QQQ): 300 the pivotal area 290 major support; 284 big support, 300 resistance.
- Regional Banks (KRE): 65.00 resistance, 61 support
- Semiconductors (SMH): 228 big support and 240 resistance; 248 resistance, 237 then 229 support.
- Transportation (IYT): Broke the 50-DMA so must confirm the warning phase--228 pivotal.
- Biotechnology (IBB): Under 130 now (pivotal).
- Retail (XRT): 66-68 huge area to hold if the market still has legs.
Mish Schneider
MarketGauge.com
Director of Trading Research and Education


