This coming week is a big one. We have FOMC on tap, with some Fed members calling for .50 bps rate hike on the heels of the hot Producer Price Index and inflation. We have Gross Domestic Product on the heels of a strong retail sales number, and record amount of credit card debt could hurt later on. We have 600 companies reporting earnings-the largest week of earnings for the last quarter. We have 2 of the 4 key indices posting 2 inside trading weeks, meaning a range within a range within a range.
In other words, the market has taken a giant pause near the recent highs.
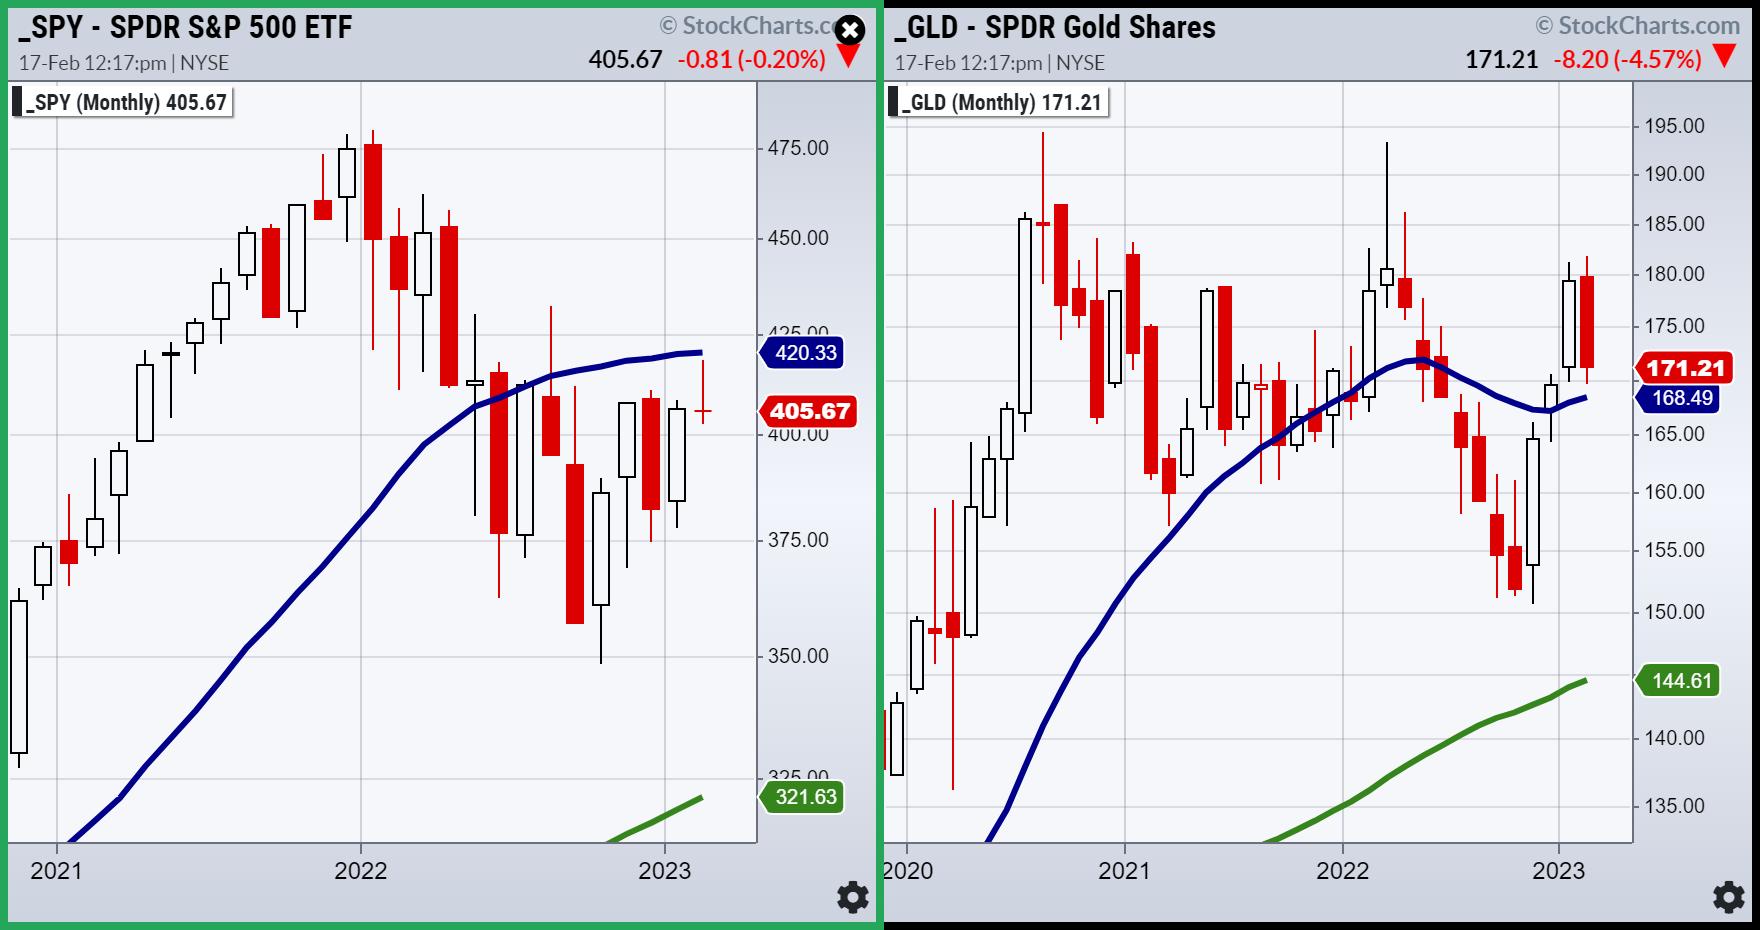
We have written about the the 23-month moving average and the correlation to the 2-year business cycle. The SPY (and most key sectors) all stopped dead in their tracks right at that moving average. Why is this significant? Because, until proven otherwise, it not only supports the trading range theory for 2023, it also shows that the rally since October is still looking like a bear market rally. Should a soft landing turn out as a possibility, then we would want to see the price of the indices and key sectors move beyond that 2-year cycle.
Meanwhile, as so many are dismissing gold, citing that a stronger dollar and stronger rates will not help the shiny metal, the chart looks very different stepping back to the same 2-year cycle. Although gold sold off for most of last week, it closed green on Friday. Gold held the key weekly and monthly moving averages.
Gold, silver, and soft and food commodities all closed in the green. Inflation is far from dead. Again, all rallied in the face of higher yields and firmer U.S. dollar.
Now, it could be that we saw the dip in gold futures to around $1820 an ounce, then the bounce back to $1850, a key pivotal point and that's that. It could also mean that the market remains highly optimistic that higher yields, even ½% higher, will not hurt the economy or the market too much. It could mean that countries and hedge funds that have been accumulating gold bought this dip, while retail investors have turned their focus more to AI, defense stocks, and consumer staples.
Too soon to say. Nonetheless, from just looking at the chart, what we can see is that gold is following through above its 23-month MA or 2-year business cycle, while the market remains agnostic at best.
For more detailed trading information about our blended models, tools and trader education courses, contact Rob Quinn, our Chief Strategy Consultant, to learn more.
IT'S NOT TOO LATE! Click here if you'd like a complimentary copy of Mish's 2023 Market Outlook E-Book in your inbox.


"I grew my money tree and so can you!" - Mish Schneider
Get your copy of Plant Your Money Tree: A Guide to Growing Your Wealth and a special bonus here.
Follow Mish on Twitter @marketminute for stock picks and more. Follow Mish on Instagram (mishschneider) for daily morning videos. To see updated media clips, click here.
Mish in the Media
Mish shares three charts she is using to measure inflation using the commodities markets on the Wednesday, February 14 edition of StockCharts TV's The Final Bar with David Keller!
Mish gives you some ideas of what might outperform in this new wave of inflation on the Friday, February 10 edition of StockCharts TV's Your Daily Five. She has picks from energy, construction, gold, defense, and raw materials.
Read about Mish's interview with Neils Christensen in this article from Kitco!
In this appearance on Making Money with Charles Payne, Charles and Mish discuss whether Powell can say mission accomplished.
Mish shares her views on how to approach the earnings announcements of Apple, Amazon, and Alphabet, and gives her technical outlook on how the earnings results could impact the S&P 500 and Nasdaq 100 in this appearance on CMC Markets.
ETF Summary
- S&P 500 (SPY) 420 resistance with 390-400 support.
- Russell 2000 (IWM): 190 pivotal support and 202 major resistance.
- Dow (DIA): 343.50 resistance, 338 support.
- Nasdaq (QQQ): 300 the pivotal area, 290 major support. Still 2 inside weeks working, so watch 311 as a good point to clear or fail from.
- Regional Banks (KRE): 65.00 resistance, 61 support.
- Semiconductors (SMH): 248 now has to clear again with 238 support. 248 resistance, 237 then 229 support.
- Transportation (IYT): The 23-month MA is 244--now resistance. 228 support.
- Biotechnology (IBB): Sideways action 130-139 range.
- Retail (XRT): 78.00 the 23-month MA resistance, and nearest support 68.00.
Mish Schneider
MarketGauge.com
Director of Trading Research and Education


