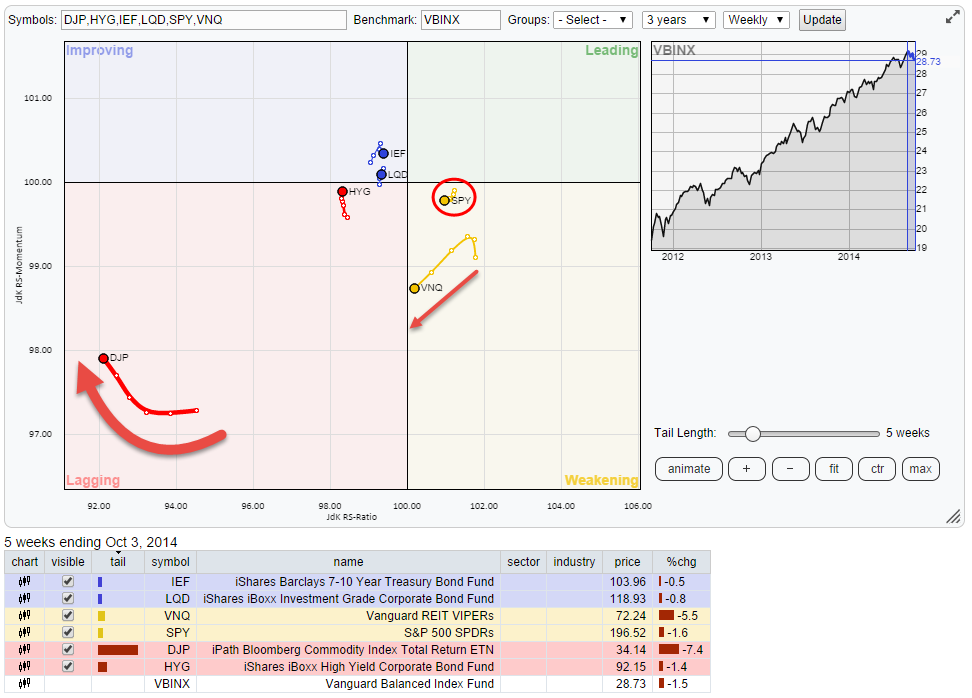
On the Relative Rotation Graph holding a number of, indices representing various, Asset Classes there are two that are standing out and deserve our attention. The first one is Commodities and the second one is Real-Estate. The graph below shows the weekly RRG chart for asset classes with a five week trail. The chart uses the Vanguard Balanced Index Fund (VBINX) as its benchmark.
Commodities
Clearly Commodities stand out deep inside the lower-left hand, lagging, quadrant. As a matter of fact they are so far off that they are distorting the rotational picture for the other asset classes in the plot (we deal with that later). Even without inspecting the price chart itself we can make an educated guess "this chart must look awful..."
Evidence provided below. This chart shows the longer-term picture for DJP, the iPath Bloomberg Commodity Index. I had to stretch the chart back more than five years to make it show that commodities are breaching their five year lows and recently took out a major support level offered by lows set in 2010, almost in 2012 and three times in Q4-2013 and early 2014. This level near $ 35,50-75 will now be a resistance level and it will, most likely, seriously limit the upside potential for the time being.
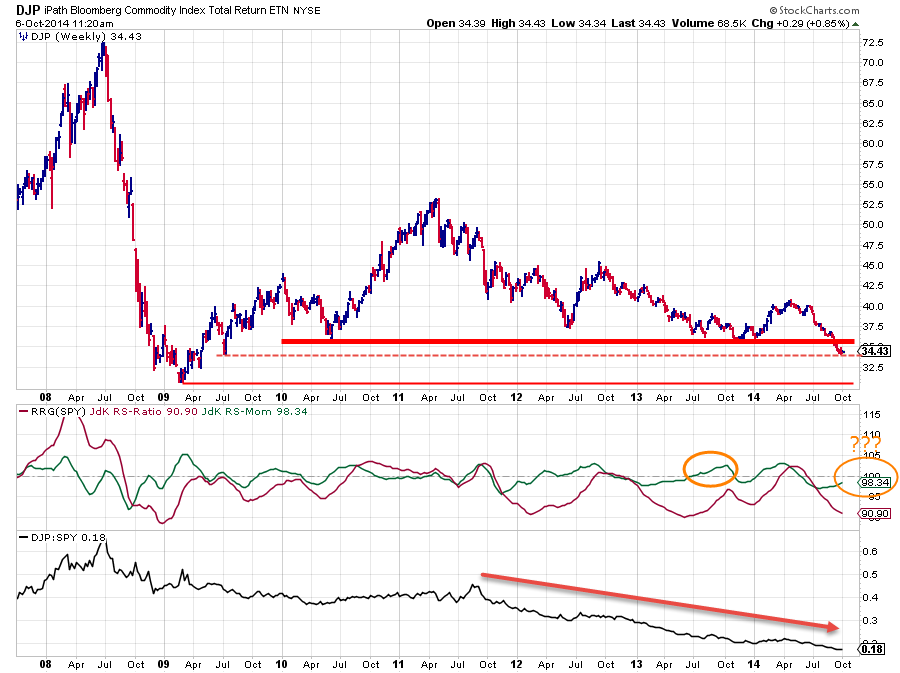
The RRG-Lines clearly indicate the very strong down trend in Relative Strength and, a little hick-up in JdK RS-Momentum, aside there are no real signs for a reversal of this trend soon.
The Trail of DJP on the RRG-chart is curving upward a little bit but at the same time still dropping on the JdK RS-Ratio scale. This indicates that the relative down-trend is still in full force but the pace is slowing down a bit. Given the position of DJP on the RRG-chart, very deep inside the lagging quadrant, at very low levels on both axes, it is very unlikely that we will see a turn in Relative Strength anytime soon. It is more likely that a rotational pattern will be completed on the left hand side of the RRG-chart like it has done last year.
From a trend-following perspective still an asset class to approach with care. If you want to look at the world through a more positive lens one could argue that the JdK RS-Ratio is now hitting levels where it turned around on 3-4 previous occasions. While this is true it is questionable if picking these lows would have made any (relative) profits as no material relative up-trend un-folded subsequently. Remember any JdK RS-Ratio level below 100 means a relative down-trend, the level only indicates it's strength.
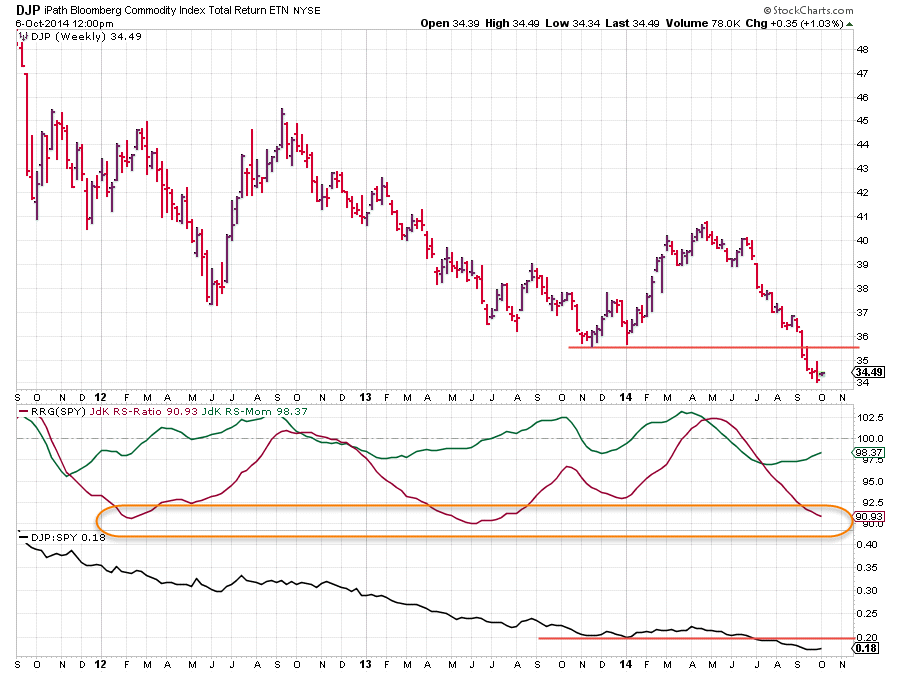
The chart below shows things in a little more detail.
Magnify the RRG-chart
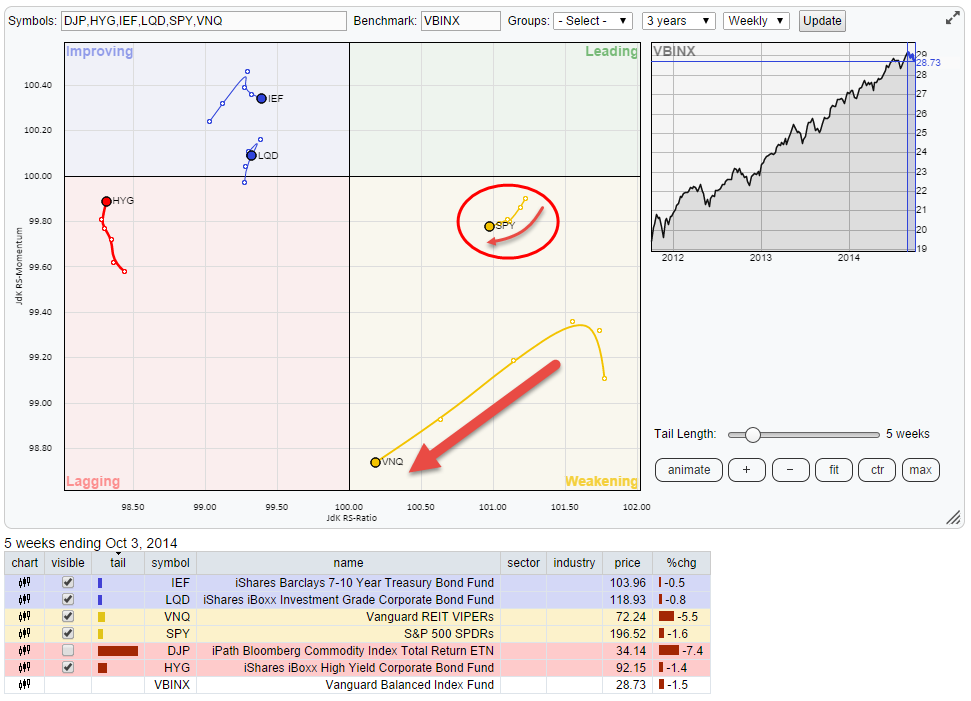
As DJP/Commodities are so far out on the RRG chart I have checked off the display for DJP and drawn a new RRG chart for the other asset classes on display. This gives a better handle on the rotation going on in the other asset classes as it is now a little more magnified, or less distorted.
Real Estate
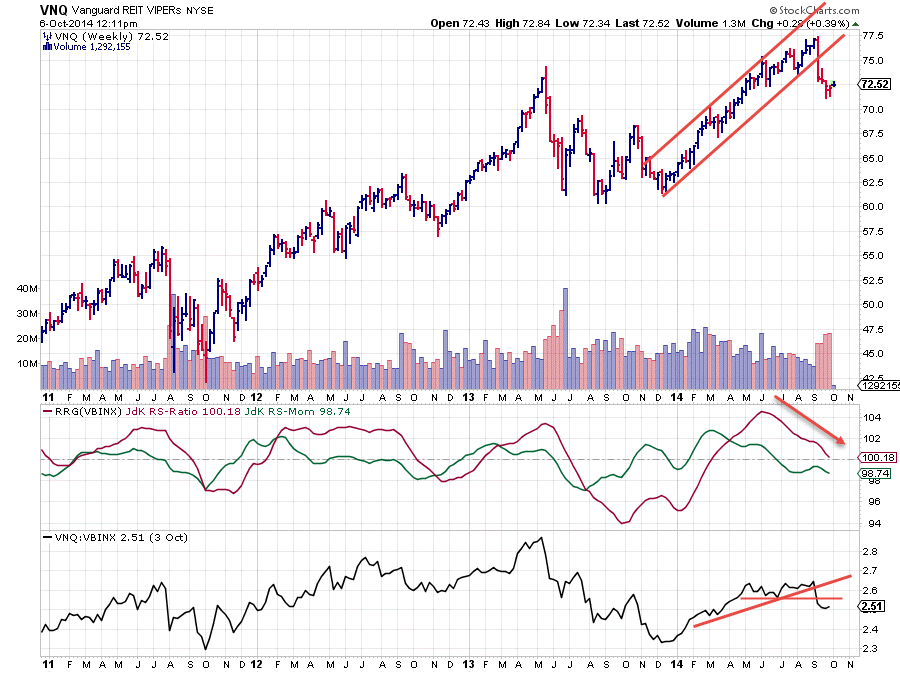
What catches the eye is the long trail on VNQ and it's heading left and lower towards the lagging quadrant. Moving left (= lower on the JdK RS-Ratio axis) and lower (=lower on the JdK RS-Momentum axis) means "bad news". The relative up-trend in which Real-Estate has been moving since the beginning of this year is on the verge of turning around.
The price chart of VNQ below with RRG-lines against VBINX is confirming this relative weakness. The rising trend-channel on the weekly price chart was abandoned already a few weeks ago, also breaking the rhythm of higher highs and higher lows. These previous support levels will now start to act as resistance and cap upside potential.
The JdK RS-Ratio is heading down fast by a falling JdK RS-Momentum and it's only a matter of time before the relative trend will definitely turn negative. Just like Commodities, the Real Estate asset class is better avoided at the moment. And, compared to my previous blog on asset classes, VNQ has now been overtaken by SPY (equities) as being the strongest asset class in this universe.
Equities overtaking Real Estate
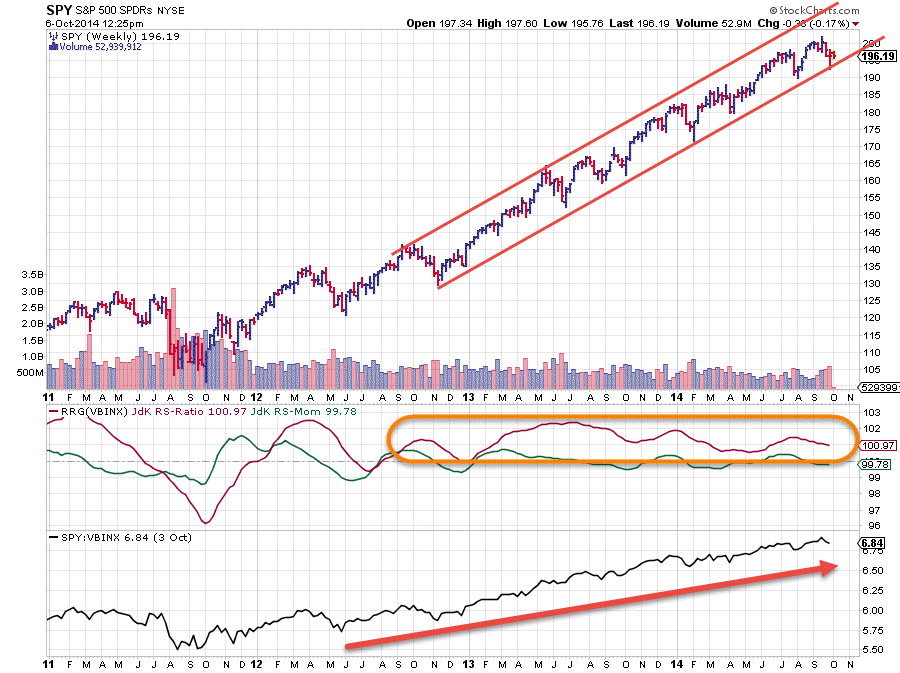
Although SPY and VNQ are both inside the weakening quadrant the length of the trail tells different stories for both. The long trail for VNQ we have seen above bodes bad news for the asset class as it is directly heading for the lagging quadrant. The trail for SPY however is just as long, 5 weeks, as for VNQ but comfortably fits in a small circle. This means that both RS-Ratio and RS-Momentum levels are stable which is confirmed on the price chart below with the RRG-lines.
The RS-Ratio is still well above the 100-mark and RS-Momentum is oscillating loosely around 100 without making big moves either way. As long as this pattern stays intact, equities remain the preferred asset class. As soon as the trail start to increase in length and move lower on both axes we need to start paying attention and make up our mind,
Conclusion
- DJP / Commodities make you go mmmmmmmm
- VNQ / Real Estate is really weakening
- SPY / Equities is overtaking VNQ and becoming the strongest asset class
Julius


