Wow...! What a difference a month makes .... I had lunch with Arthur Hill yesterday in Breda (the Netherlands) which is halfway where he lives in Belgium and where I live in the Netherlands (Amsterdam). Obviously the discussion was mainly about the freaky market move we have seen in October. At one point Art nailed it with the statement: "I think that a lot of fund managers wish they had taken a holiday in October".. it would have prevented them from taking wrong decisions.
The Relative Rotation Graph for asset classes clearly shows some unexpected turns. Below is the RRG holding a number of asset class ETFs compared to VBINX which is the Vanguard Balanced Index Fund.
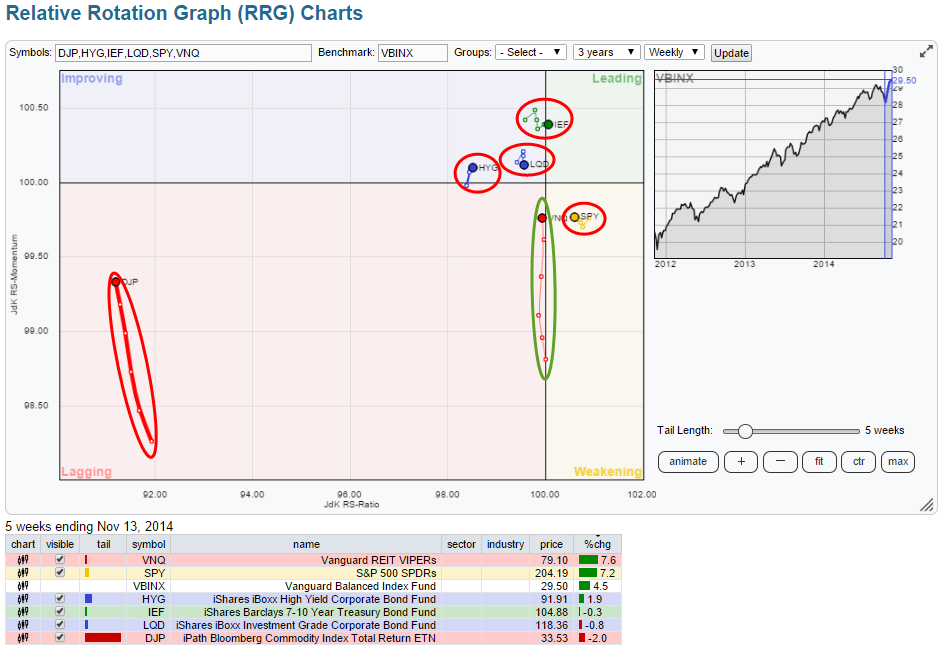
The 5 week tail on this RRG goes back roughly to the time of my previous post on asset classes. Let's look at where we are now as there are a lot of similarities and one real (-estate) big difference.
Commodities remain very weak
The first and most obvious observation that can be made from this Relative Rotation Graph is that Commodities is still the weakest asset class... by far. They are way out on the left and deep inside the lagging quadrant. Yes they do have a long tail but when a security is so far out and so deep inside negative territory it is pretty safe to classify this run-up in relative momentum as a "recovery within the longer-term falling trend". The other asset class with a long tail is real-estate (VNQ), this provides an interesting picture as the move is nearly vertical and more or less exactly at the 100-level on the JdK RS-Ratio axis, this deserves a better look.
The other asset classes on the plot; Government Bonds (IEF), Corporate bonds (LQD), High Yield bonds (HYG) and Equities (SPY) are all characterized by a very short tail and with little movement over the past few weeks, this means that their relative position has not really changed over the past few weeks.
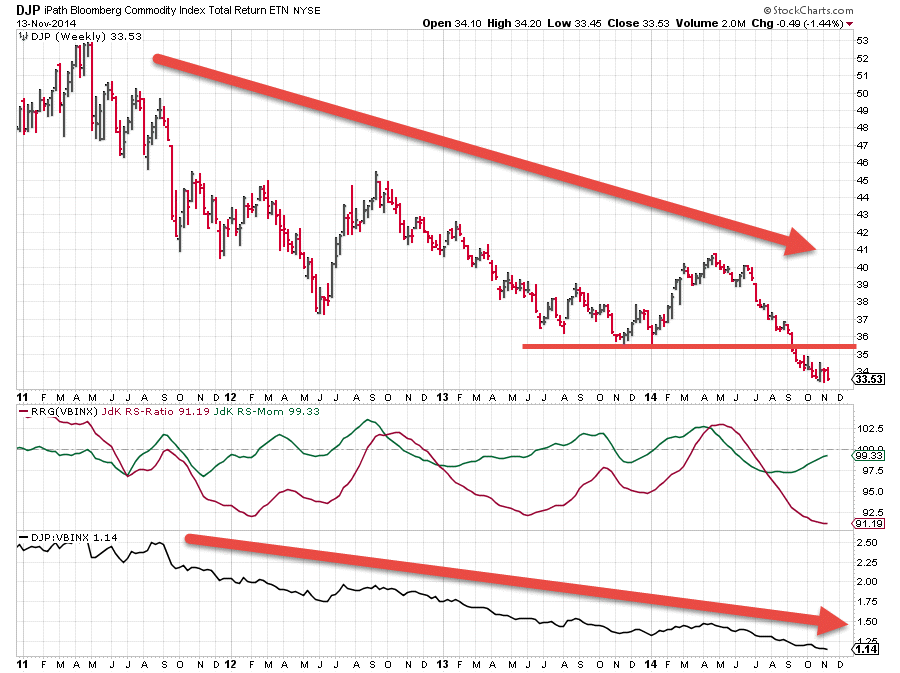
Looking at the price chart of DJP (iPath Bloomberg Commodity Index Total Return ETN) it is easy to spot where the move higher on the RRG chart is coming from. The (green) JdK RS-Momentum line started to move higher a few weeks ago, caused by the slow-down of the decline in the (red) JdK RS-Ratio line. But by simply eye-balling the trend on the price chart as well as the trend in relative strength (lower pane) I believe it is fairly safe to say that Commodities are still solidly caught in a down-trend on both the price and the relative charts!
So for the time being it seems wise to avoid (overweight) positions in commodities from an asset allocation perspective.
Real Estate caught up towards benchmark performance rapidly
If we tick off the box in front of commodities in the table below the RRG-chart we will be able to make better us of the real-estate on the chart and zoom in on the relative positioning of the other asset classes.
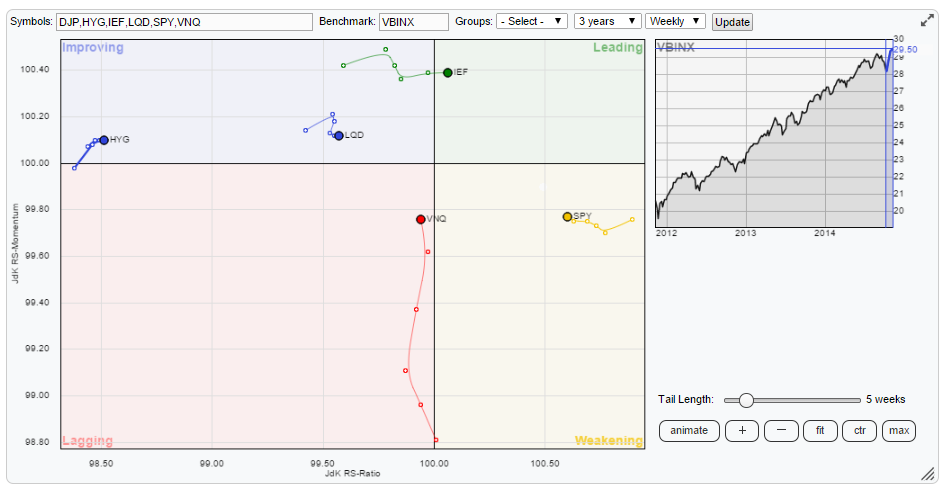
This RRG shows us a bit more detail about the recent relative movement of the various asset classes. Let's tackle the strong momentum based move of VNQ first.
This tail is a tricky one to analyze. About five weeks ago the real-estate sector was heading clearly lower on both the RS-Ratio and RS-Momentum axes and on the verge of crossing into the lagging quadrant. The crossover into the lagging quadrant actually happened but almost immediately after doing so VNQ turned sharply upwards and started moving higher on the RS-Momentum axis while remaining steady on the RS-Ratio axis, just shy of the 100-level. At the moment the momentum move seems to slow down given the shorter distance between the last two observations on the tail. The move clearly made VNQ catch up with the benchmark again and the current position, very close to the benchmark (crosshairs) suggests a performance in line with the benchmark.
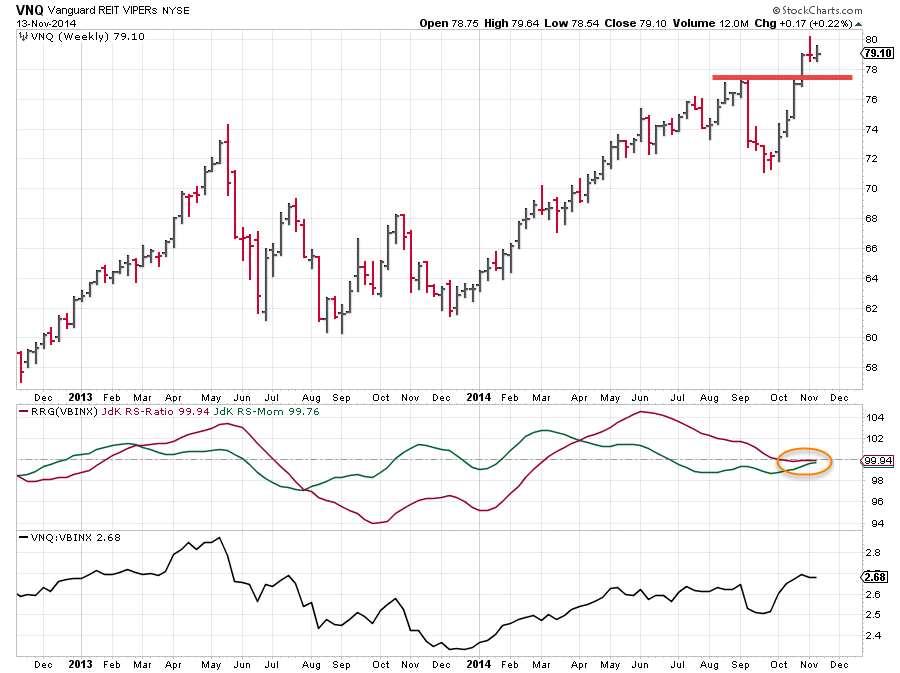
This situation makes it difficult to make a call on the next direction. Especially as the relative strength trend is moving as good as flat and can go either way. A "wait and see" approach is needed here I'm afraid.
Government bonds strongest within fixed income space
On the plot we have three fixed income related asset classes; government-, corporate- and high-yield bonds.
If we work from left to right we find high-yield (HYG) still clearly on the negative side of the spectrum. Given its position on the RS-Ratio axis and the lack of relative momentum it is very likely that this little hick-up is exactly what it is, a hick-up, and that the relative down-trend versus VBINX is still in full force and likely to continue. Corporate bonds (LQD) are stronger than High Yield given their position on the RRG but still weaker than the benchmark. The lack of momentum does not suggest a strong improvement of relative strength in the near future.
Government bonds (IEF) finally are showing the longest tail of the three AND they are moving higher on the RS-Ratio scale AND they have just moved into the leading quadrant.
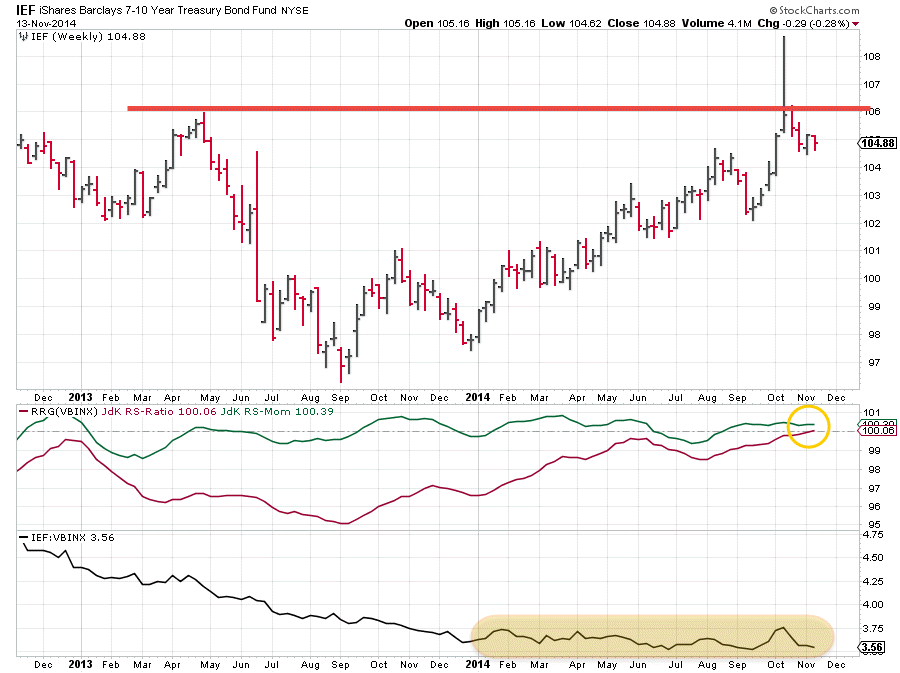
The chart above shows that the relative down-trend of IEF vs VBINX visible in 2013 has came to rest and flattened out during 2014. This caused the RRG-Lines to move closer to the 100-level which is the benchmark. In other words no big differences and therefore no big over- or under performance to be captured against a balanced portfolio.
The bounce off the horizontal resistance level in combination with the big spike above that level makes me a little cautious, it suggests a lot of selling pressure in that area and that will not help the relative strength. As said IEF just crossed above 100 and into the leading quadrant but the lack of momentum (power) behind the move and the proximity to the benchmark raise doubt about the sustainability of this move. Careful please!
Equities remain strongest
The last asset class on this RRG is equities (SPY) they remain on the right hand side of the plot indicating an up-trend in relative strength against the balanced benchmark albeit inside the weakening quadrant due to a little loss of momentum. Looking at the price chart of SPY in combination with the RRG lines against VBINX leaves little doubt. This market is still in a strong up-trend in price terms. In relative terms equities got a dent in the October move but have recovered back to relative strength levels prior to that shake out. From a relative strength perspective I would like to see a break above the previous highs in the RS line again to confirm the continuation of the up-trend in RS as well as in price... You can monitor that move yourself on the chart here.
The one other comparison that can be made is to run SPY directly against IEF, this is done in the chart below.
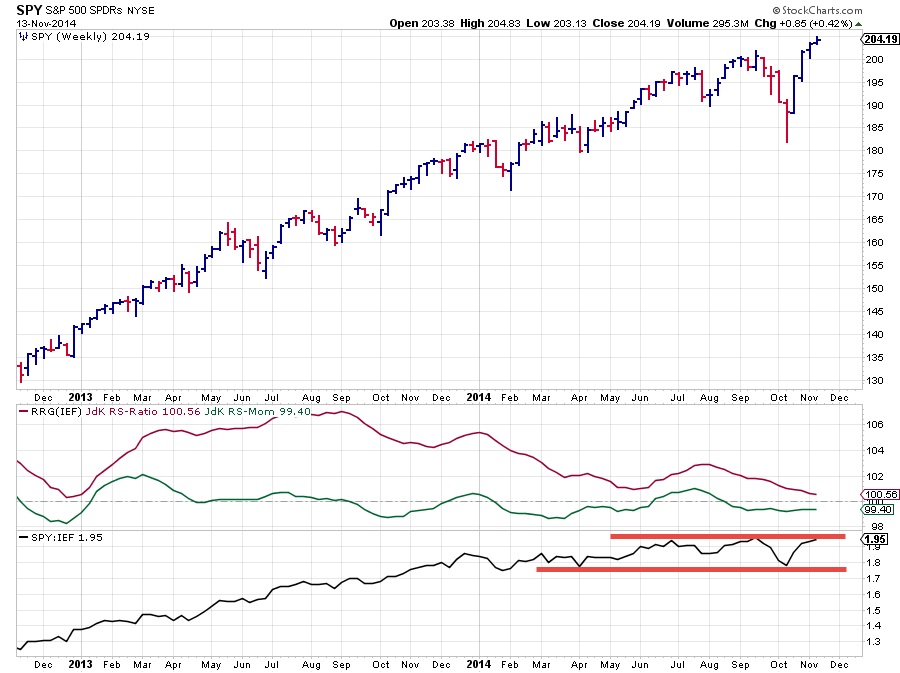
Not surprisingly this is not much different from the comparison against VBINX. Firstly because both SPY and IEF are obviously major components of a balanced portfolio and secondly because they are both moving very close to the benchmark. Unfortunately this makes the (RRG) picture less pronounced and making a call for either equities or (govt) bonds harder but I will make an attempt anyway. Given the facts that
- Equities are moving further right on the RRG plot compared to IEF
- SPY broke back above its previous peak after the October shake out
- IEF bounced back off its previous peak after a spike above that level
I am inclined to stick with an out performance for equities over (govt) bonds for the time being and equities remaining the strongest asset class in this universe.
Conclusion
- Commodities / DJP remain very weak in relative terms
- High Yield / HYG and Corporate Bonds / LQD remain underperformers against VBINX
- Real Estate / VNQ caught up with the benchmark, waiting for a decisive move either way.
- Equities / SPY still preferred over Government bonds / IEF
- All in all it still looks like a risk ON environment
Julius de Kempenaer | RRG Research


