Last Tuesday I joined Arthur Hill's market message webinar which was great fun. Not only because the (stock selection) approach we are taking makes total sense, at least that is what I tend to believe. But also because it gives Art and myself a good excuse to meet for coffee and lunch somewhere between Mechelen in Belgium, where Arthur lives, and Amsterdam in the Netherlands where I am.
We need to prepare ourselves properly don't we?
If you could not make it to watch the webinar live you can watch the recording here. Even if the views will lose their actuality, the approach we are taking and the tools we are using will remain interesting enough to watch and maybe embed them into your own work-flow when you like them.
This week it's time to look at the Dow Jones Industrials universe again...
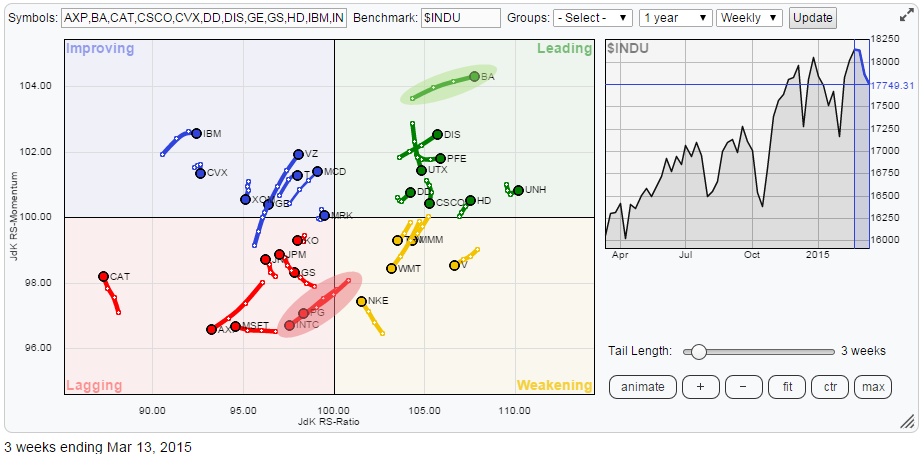
On the Relative Rotation Graph above we can see the rotation of trends in relative strength of all 30 stocks against the Dow ($INDU) and against each other. A few names catch my attention right away.
These are Boeing (BA) in the top-right 'leading' quadrant and Intel (INTC) and Procter and Gamble (PG) in the bottom-left 'lagging' quadrant.
Intel Corp. (INTC)
On the RRG above Intel is moving lower, already inside the lagging quadrant, on both axes at nearly -45 degrees. This means that the relative trend of INTC against the Dow is down and that this down-trend is still being pushed lower by weak momentum. A weak picture!
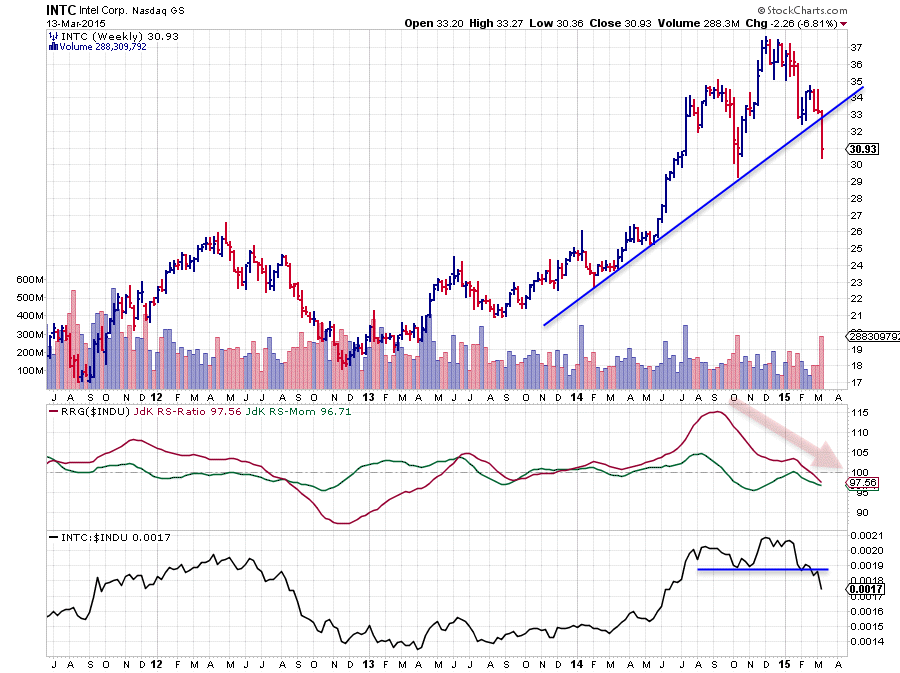
This is confirmed when we study the weekly price chart above in combination with the RRG-Lines and relative strength vs $INDU. On the price chart the rising support line has clearly been broken downward and the decline started accelerating immediately after the break. The former low in the 29-30 area may provide some support in the near term but what is more important is that a new series of lower highs and lower lows has started and that upward potential is now capped at the previous low around 32.50. Hence downside risk is now bigger than upward potential which makes Intel less attractive for long or overweight positions.
From a relative perspective the JdK RS-Ratio line has crossed below the 100-level in the last week of February after the raw RS-line broke below horizontal support 2 weeks earlier. This suggests that also from a relative perspective a (new) down-trend has started, calling for further under-performance in the weeks/months to come.
Weekly vs. Daily rotation on INTC
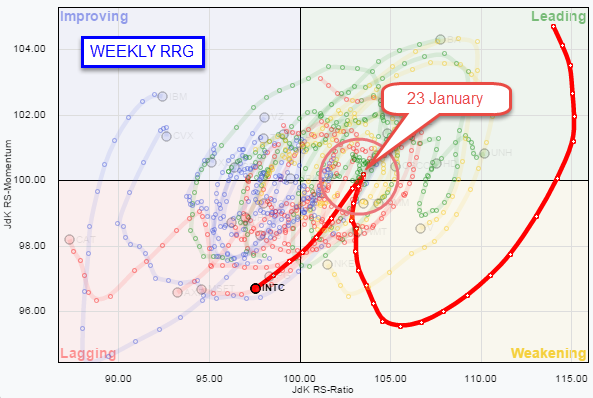
If we lengthen the trail of INTC on a weekly RRG as seen on the left picture above, a sharp 'hook' becomes visible, which could lead to the belief that the rotation moved counter-clockwise. This sharp move occurred in the week ending 23 January. Before then INTC showed strong relative strength and even crossed back up into the leading quadrant after a period of weak momentum while still in a relative up-trend against the Dow.
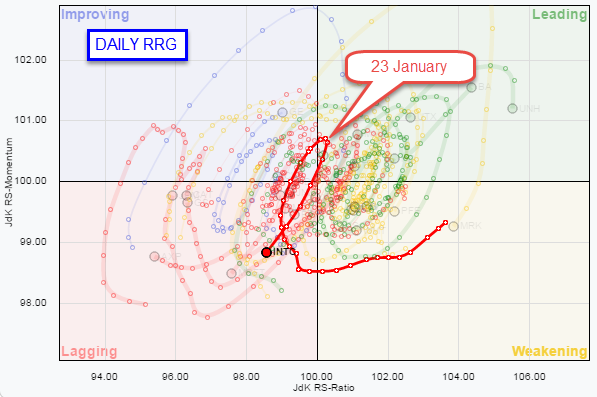
If such moves occur it is always a good idea to inspect the daily RRG over the same time period. This is done in the RRG picture on the right. This is a daily Relative Rotation Graph. And what you see is that the clockwise rotation is very well visible on the daily time-frame with the apex of the turn being made on the 23rd of January.
Procter & Gamble Co.
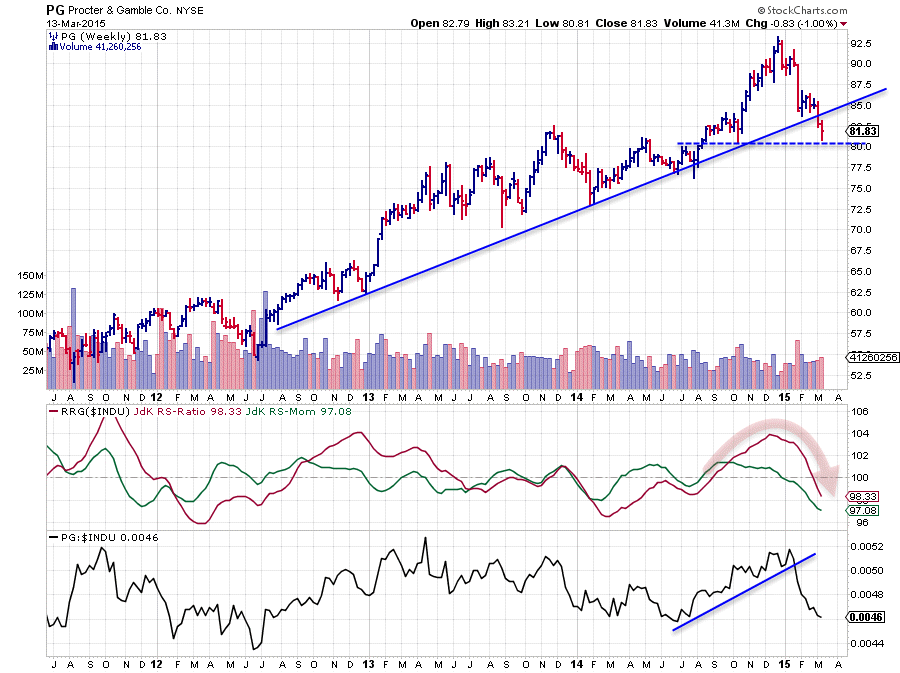
The price chart above of PG shows a somewhat similar picture as we saw on INTC.
The up-trend on the weekly bar-chart has recently been broken downward and price started to accelerate down. An intermediate support level is showing up around 80. This level can stop or pause the decline in the near term but as former support levels, in this case the former rising trend line and the previous low are both near 82.50, will start to act as resistance here also upward potential is very limited while downside risk is increasing.
The relative outlook is not much better. The raw RS-line rapidly started to decline after it broke an upward sloping trend-line that was visible since mid 2014. JdK RS-Momentum already dropped below 100 prior to the break of rising support in the RS-line and the JdK RS-Ratio line followed rapidly after that. This means that we now have a relative down-trend against the Dow with still further weakening relative momentum.
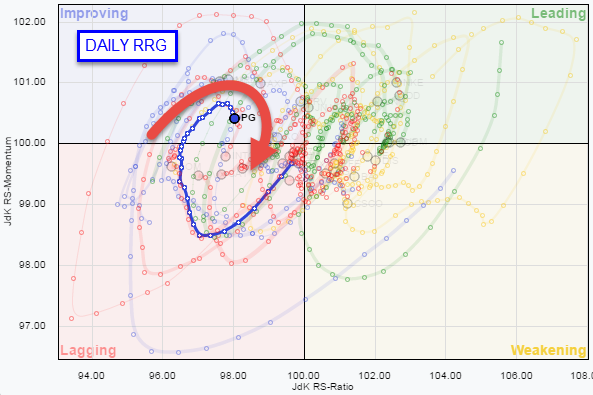
Weekly vs Daily rotation on PG
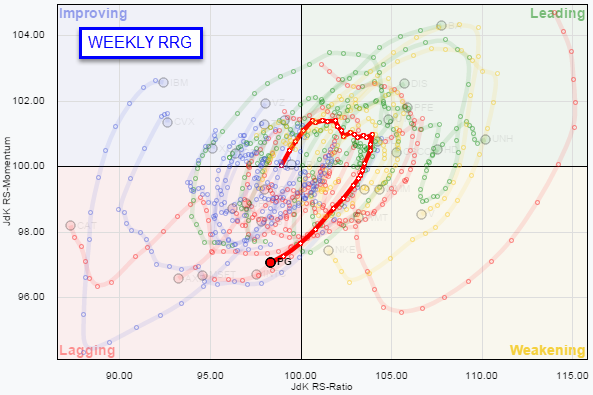
Zooming in on the daily rotation of Procter & Gamble on the Relative Rotation Graph vs the weekly rotation underscores the further weakening of the relative strength of this stock. On the weekly RRG (left picture) we can see that the distances between the weekly observations were getting closer to each other compared to a few weeks ago. These smaller distances travelled on the weekly RRG indicate that the recent move has not been as fast as before.
The daily rotation shows why. Here the rotation briefly picked up relative momentum and even managed to reach into the improving quadrant. However this pick-up in relative momentum seems to be ending already and the trail has started to turn back down pointing towards the lagging quadrant again.
Assuming that the rotation on the daily chart will continue its current direction we can expect the relative down-trend to accelerate in coming weeks.
Boeing Co. (BA)
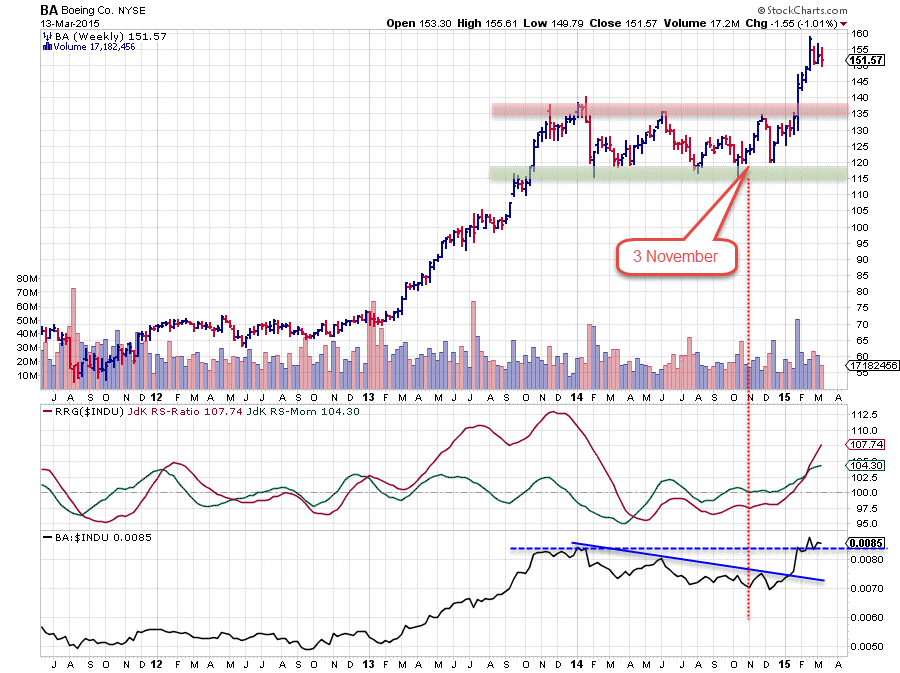
While I am writing this blog I remembered having written about Boeing previously. So I looked back in the archive to find the article and see what has actually happened. Back in November (3rd) last year the blog title was 'Boeing on final approach for landing at lagging runway'. What I did not remember was that I wrote about PG in the same article. At that time the relative trend for BA was down and as you can see in the chart above would remain sideways to down for another two months. The view on PG was that there would likely be 'more in the relative store' this move also carried on for another two months until January before the trend started to turn around. From a relative perspective BA and PG are pretty much each others' opposites since mid 2014.
On the price chart of Boeing above, a broad trading range is visible between 115 and 135. The raw RS-line was kept below a declining resistance line until the beginning of this year. The JdK RS-Ratio was at a steady level below 100 while the JdK RS-Momentum line was almost flat around 100 during Q4 of 2014. In December the RS-Momentum line started to edge higher, then the raw RS-line broke above its resistance line and in January the RS-Ratio line crossed above 100, indicating that a new relative up-trend had started. Then in the last week of January price broke out of its trading range and started to accelerate.
Based on the width of the range a price target could be pegged around 20 dollars higher near 155. That target has now been satisfied but as you know price targets based on the technical chart-patterns are minimum guide-lines that you can use to determine if the risk/reward of a potential trade off of such a pattern is worth your while and more important your investment. It does not mean that a move has to end when a target is reached.
When I concentrate on the relative trend I see that the raw RS-line has just broken to new highs and that both the JdK RS-Ratio and the RS-Momentum lines are powering higher. All in all it looks as if BA and PG have swapped places in favour of BA this time. The landing in Q4-2014 turned into a touch and go for Q1-2015.
Conclusion
- Intel and Procter & Gamble expected to remain in weak relative trends
- Boeing heading higher in relative strength
Julius de Kempenaer | RRG Research
RRG, Relative Rotation graphs, JdK RS-Ratio and JdK RS_Momentum are registered TradeMarks by RRG Research


