Sector time!
With the general market picture being a bit 'un-clear' and showing pretty wide swings from week to week, the Relative Rotation Graph holding the ten (I added XTL - Telecom) sector ETFs will shine some light on the sector rotation that is going on within the S&P 500 index at the moment.
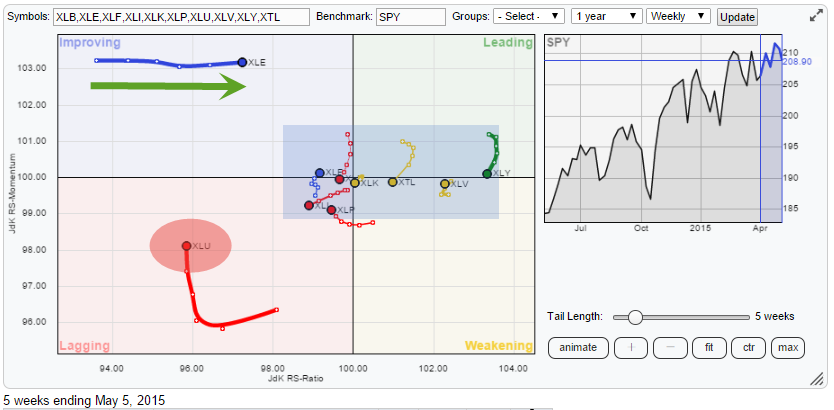
On the RRG above there are two sectors that are really standing out at first sight. These are Energy (XLE) in the top-left, improving, quadrant and Utilities (XLU) in the bottom-left, lagging, quadrant. The remaining sectors, as you can see, are all confined within a narrow range on the JdK RS-Momentum axis.
Utilities (XLU)
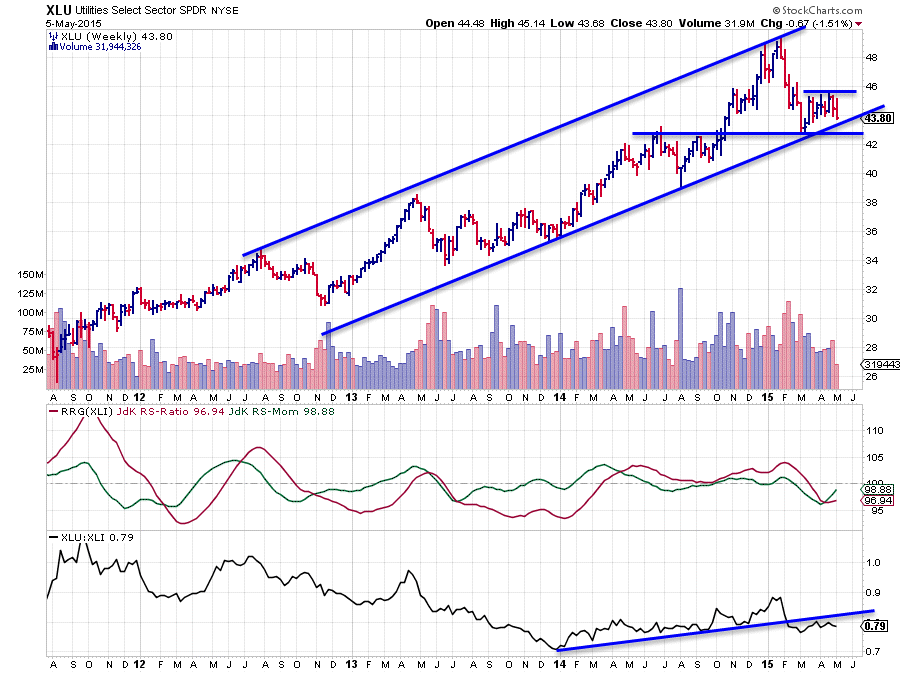
The big picture for the Utilities sector based on the weekly price chart above still seems fairly ok. The sector is still within the boundaries of a rising channel that can be seen over the past 2-2.5 years. The thing that is, at least in my eyes, a little worrisome is the fact that the recent rally off the lower boundary of that channel seems to have formed a lower high while there is very little room left for a correction within that trend without breaking below the lower boundary. At the moment price is hovering above the rising support line and only slightly lower there is a horizontal support level coming off the consolidation area that was formed mid-2014.
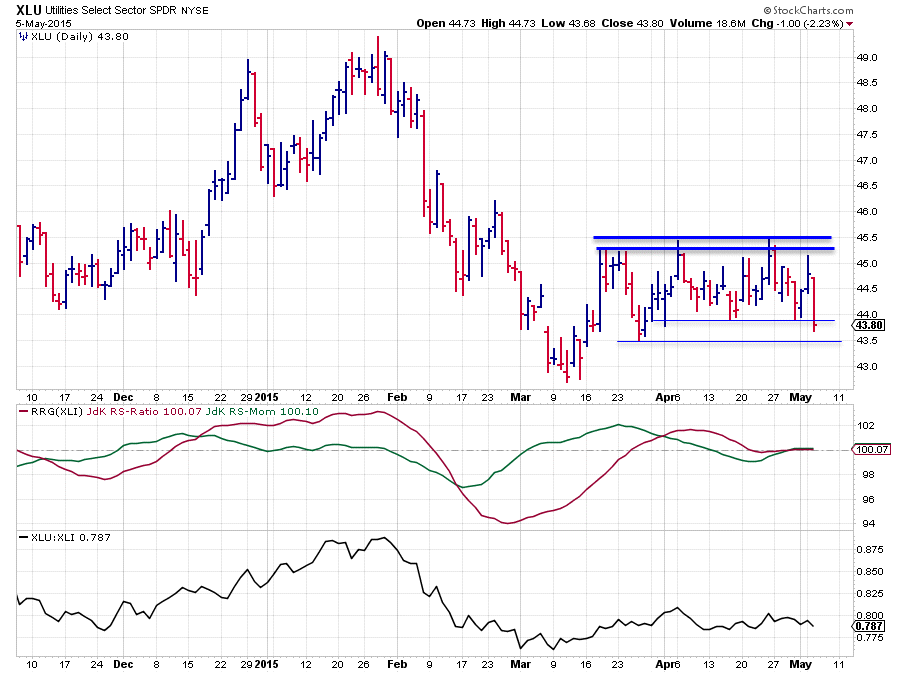
Zooming in on the most recent price action on a daily chart shows a bit more detail.
During the month of April the horizontal resistance level near 45.50 was tested a few times. On the lower end the area between 43.50 - 44.00 started acting as support. The latest move however took the index below 44.00 and now there's only a very small bit of support left at 43.50.
And as we can recall from the weekly chart. All of this is happening just above the longer-term rising support-line. Simply using the height of the recent trading range (around $ 2.00) to calculate a possible target in case of a break lower comes down to the 41.00 / 41.50 range which is well below the horizontal support levels (horizontal and rising support line) on the weekly chart.
This whole set-up makes an acceleration of downward price action in case of a break below these two support levels very likely.
From a relative point of view the outlook is a bit more clear. Or maybe I should say: "a bit more clearly negative".
Starting at the raw RS-Line, plotted in the lower pane on the chart above we can see that the rising trend-line which was in play since early 2014 has been broken downward a few months ago. After the break relative strength started to move sideways but has not been able to break higher again and has now formed two (maybe one and a half) highs against the old support line which is now acting as resistance. Clearly the way up has more hurdles to overcome than the way down...
This resulted in the RRG-lines dropping below the 100-level and measured on the JdK RS-Ratio axes this sector is now the weakest in the universe since a few weeks. Recently JdK RS-Momentum has been on the rise, but still below 100 and it is questionable if this momentum hiccup will be able to drag relative strength all the way up again, especially given the distance from the benchmark and the 100-level on the RS-Ratio axis. Combined with the weakening picture on the price chart I remain cautious with regard to (relative) performance of this sector in coming weeks/months.
Zooming in on the Relative Rotation Graph
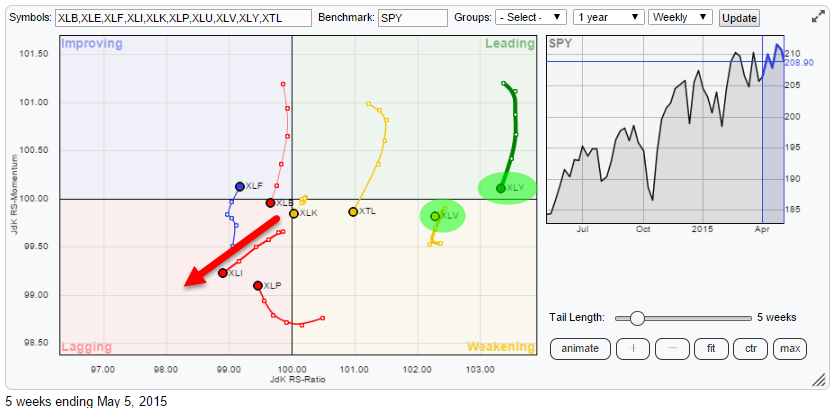
Taking off Energy (XLE) and Utilities (XLU) gives more insight into the rotation of the other sectors and this immediately shows that the industrials sector is heading straight into the lagging quadrant, heading lower on both axes at the same time. This picture also reveals that, measured on the JdK RS-Ratio axis Consumer Dscretionary (XLY) and Health Care (XLV) are still showing strong relative trends within this universe even despite their loss of relative momentum recently.
Industrials (XLI)
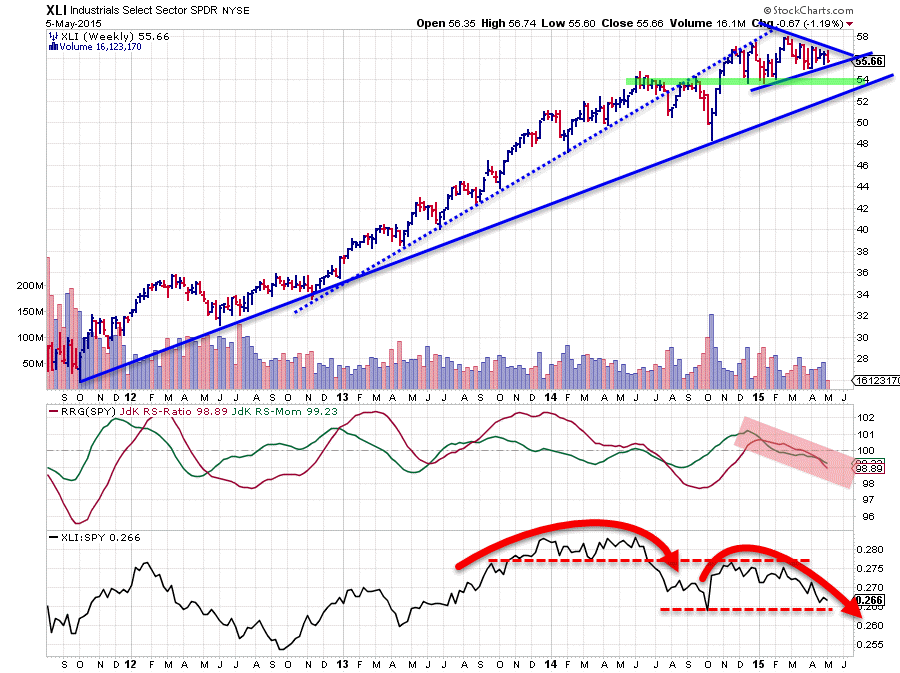
When I look at the weekly chart of the Industrials sector above I get some 'mixed feelings'.
The price chart itself is not all that bad. The long term support line running under the major lows since late 2011 is still intact and the current price is well above this level which gives some comfort. Price action since the beginning of this year has been more or less flat and a triangle like formation can be seen. However as far as I'm concerned it does not qualify as a roper triangle (any more). First of all I think there is a high 'missing' on the upside of the formation but more importantly the sideways price action within the formation has surpassed the 2/3-point of the length of the formation before which we should have seen a breakout on either side to have a meaningful 'signal'. As this did not happen my best guess is that we will simply see some more sideways consolidation in case of any breakout. No fireworks expected here on either side.
The relative picture on the other hand is, much, more pronounced and it is not all that positive. The raw RS-line in the lower pane shows two broad tops of which the second is at a lower level. At the moment the relative strength of XLI vs SPY is approaching the low in between those two tops. A break below that trough will confirm that a relative down-trend is intact and it will most likely cause an acceleration of that trend.
In the RRG-Lines the relative down-trend has already been picked up as can be read from the JdK RS-Ratio below the 100-level while being 'supported' lower by an equally low JdK RS-Momentum line. This constellation of the RRG-Lines (both at roughly the same level and at the same pace) is causing a trail that points almost exactly South-West on the Relative Rotation Graph. A clear sign of sector rotation out of industrials.
Energy (XLE)
At the moment it looks as if this money is flowing into Energy.
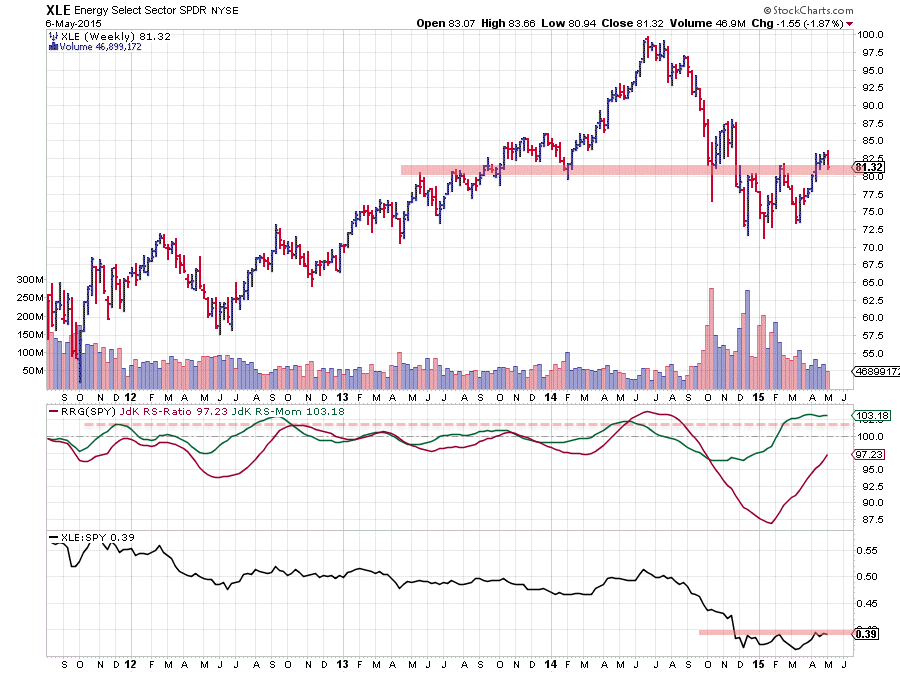
On the price chart the vague outline of an up-trend is starting to get visible. The highs are higher than the previous highs and the lows are higher than the previous lows. BUT the lows are still set at levels below the previous highs which indicates that this trend is not all that strong. It is happening again this week, the last rally managed to break beyond the previous high but the current setback is again trying to breach this level to the down-side.
The raw RS-Line started to move sideways and is now attempting to break beyond its previous relative high. This flattening causes the JdK RS-Ratio to move higher and start dragging up the JdK RS-Ratio line. The problem is that this RS-Ratio line had to come from very low levels and if we look at the current level of the RS-Momentum line we can see that it is already moving at a relatively high level for a few months. The oscillating nature of momentum in general makes it questionable if this pace can be maintained without interruption.
So for the time being the sector rotation seems to be out of Industrials and into Energy but we will have to wait and see if this flow is strong enough to carry XLE all the way into the leading quadrant again.
Conclusion:
- XLU and XLE standing out
- remaining sectors very close to 100 level on Momentum axes
- XLU move judged as rally within longer term falling trend
- XLI heading straight into lagging quadrant
- XLY and XLV holding up positive relative trends despite loss of momentum
- XLE looking good but doubts about ability to maintain current pace
Please share your views, questions, remarks, wishes etc in the comments below. I will read them all, try to respond and maybe (who knows?) will be able to cater to your wishes :)
Julius de Kempenaer | RRG Research
RRG, Relative Rotation Graphs, JdK RS-Ratio and JdK RS_Momentum are registered TradeMarks by RRG Research


