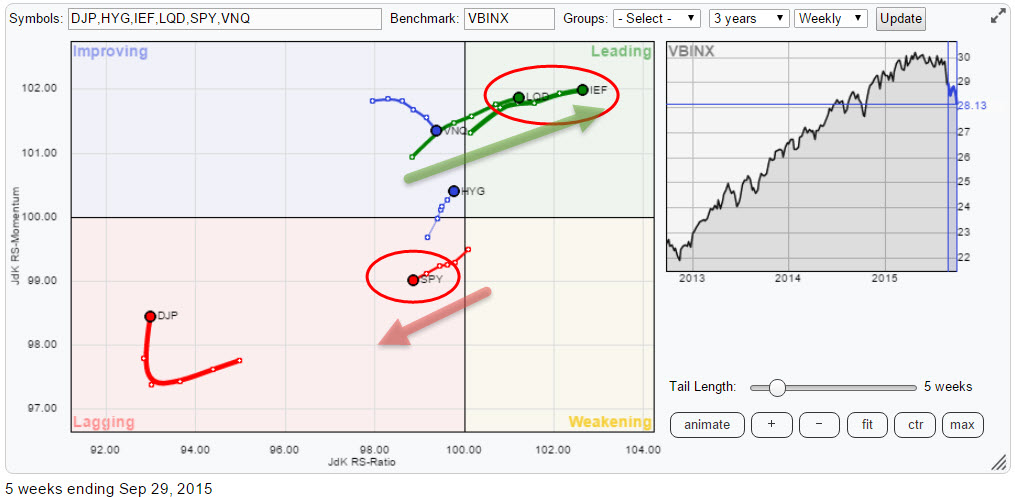
The Relative Rotation Graph below shows the trends in relative strength for a number of asset classes against the Vanguard Balanced Index Fund (VBINX). The most important message sent by this chart is the opposite move of equities (SPY) versus bonds (IEF and LQD) indicating that the Equity / Bond ratio is now clearly trending lower which suggests a preference for bonds over equities.
Equities - SPY
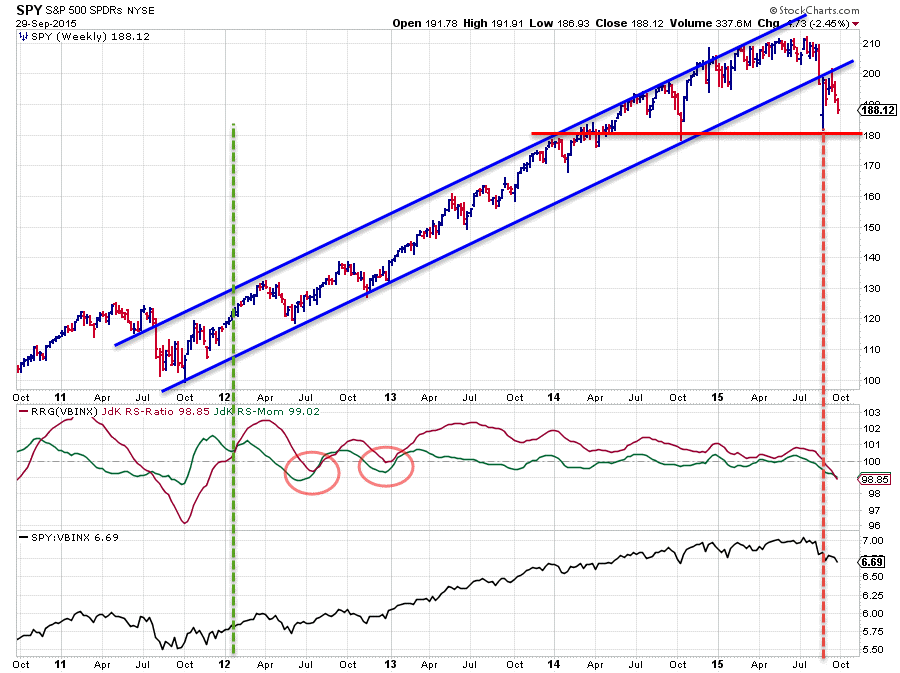
Above is an updated chart of SPY taken from the previous blog on asset class rotation. At that time, the JdK RS-Ratio line was just about to cross below the 100-level indicating a new downtrend for SPY versus VBINX and price had just broken the rising trend line. After the initial acceleration after this break SPY rallied back and tested the former rising support line as resistance. At the moment, SPY is on its way for a test of the August low. It is interesting to see that SPY here is differing from $SPX as the latter is already much closer to the level of the August low than SPY.
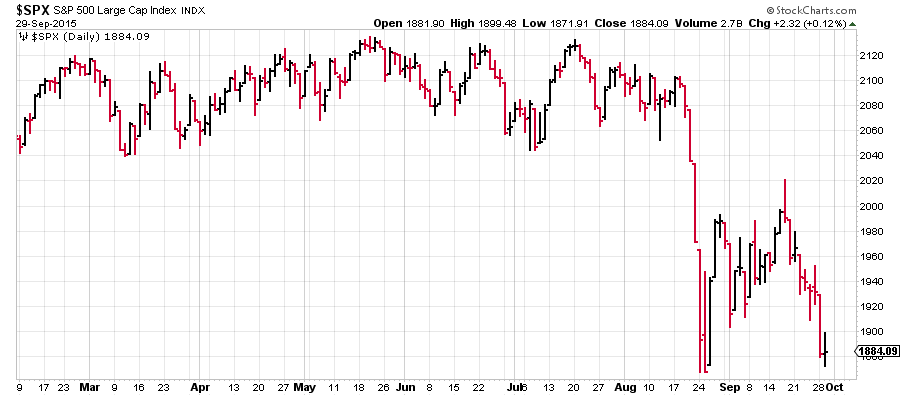
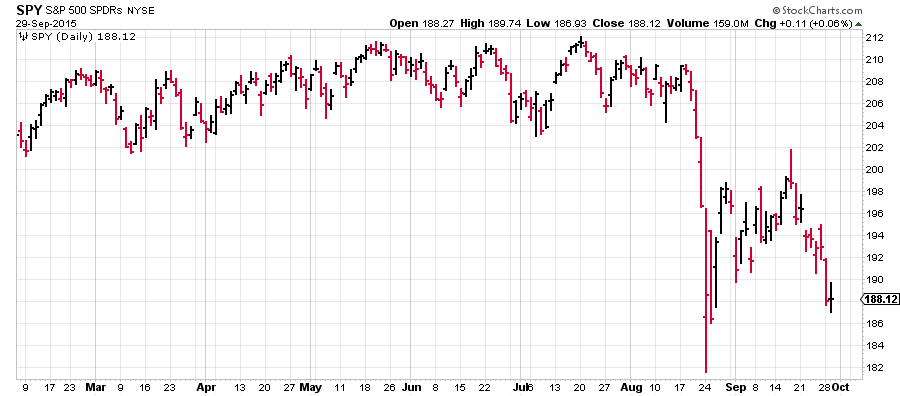
This is a good example of discrepancies that can occur between ETFs and the index they are tracking. For this reason, I prefer to use the index chart as guidance as THAT cart is leading. The ETF is tracking the index NOT the other way around. An ETF is just an instrument that allows investors to easily create exposure to a specific index. When there is a difference between the index and the ETF, the ETF is wrong, not the index. This happens when traders and investors are getting ahead of themselves "assuming" a move in the index and putting a bet on the ETF, when the move in the index does not actually happen the price of the ETF may have been over- or under-shooting the index and thus creating a bigger than normal difference / tracking error.
Reading from the hard, right-hand side of the chart I think we can now conclude that the uptrend in price has been broken and that the first signs of a downtrend, probably not secular but at least intermediate in length, is starting to unfold. On the relative charts, the RRG-lines (JdK RS-Ratio and JdK RS-Momentum) are indicating a relative downtrend versus VBINX as they are both below 100 now and this coincides with a new series of lower highs and lower lows starting to form in the raw RS-Line.
The August low which is 1865 in $SPX and $ 181.50 in SPY will be an important level to watch. Given the reasons above I am watching $ 186 in SPY. If this gives way another negative signal will be triggered and very likely be followed by another acceleration down. The relative strength line does not have a lot of support to lean on and is expected to move lower in coming weeks.
Government Bonds - IEF
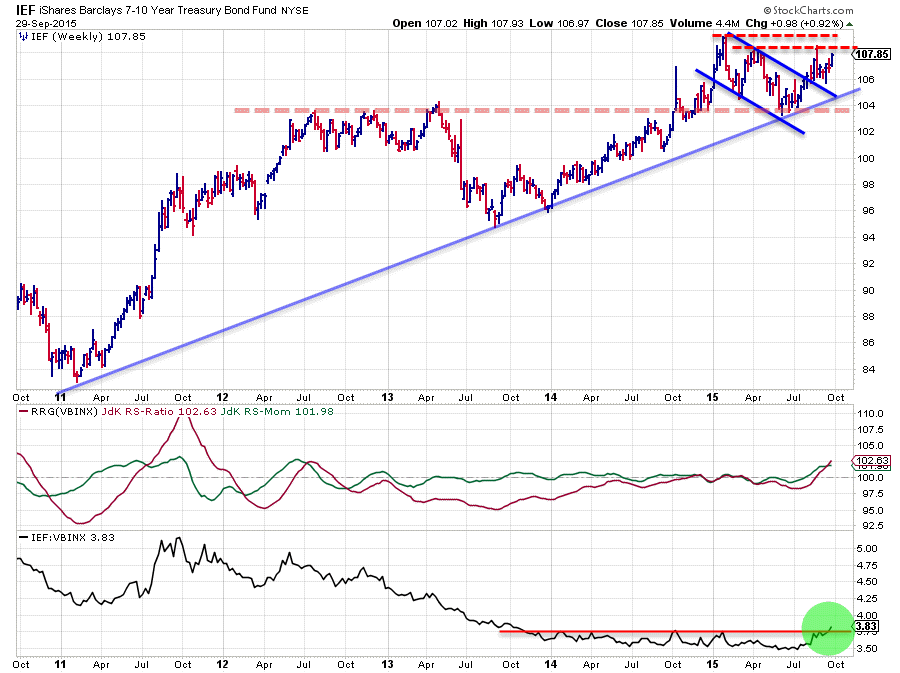
The rising support line on the IEF chart, connecting the lows of 2011, 2013, 2014 and 2015 is still intact. During the first half of 2015 a series of lower highs and lower lows formed a falling trend channel but support was strong enough in the 104 area to prevent a further decline. Out of that newly formed low IEF has started to move higher again and is now challenging resistance in the 108-109 area.
Don't be fooled by the fact that these levels are (close to) all-time highs for IEF and you may think that there is not much more room for upside left as yield is already very low. The first reason is that IEF, like all tickers on StockCharts.com, is a total return series which means that the historical coupon (or dividend) payments have been included in the price development that you see on the chart. For a ticker like IEF, this has a higher impact than for a generic stock like IBM or MCD. The second reason and that is something not a lot of people realize, is that a 0.5% drop in yield from 2% is a much bigger move in price than a 0.5% drop down from 8%. A very rough 1-1 comparison learns that in the first case price of a bond (or ETF in this case) would rise 25% while in the latter case the price of the corresponding bond would rise only 6.25%. In other words, even despite very low levels in yield prices of underlying bonds can still show very big swings up and down.
If IEF can take out the aforementioned resistance area between $108-109 higher prices and thus lower yields are expected to follow. From a relative point of view, IEF has started to move already. For the past year and a half, the raw RS-Line (black line in the lower pane) has moved more or less sideways. This sideways move resulted in the RS-Ratio line very slowly crawling back up towards the 100-level. In the past few weeks, the RS-line has crossed above a solid horizontal resistance level which kept relative strength down since late 2013. This barrier is now gone, opening up a lot of upside potential for IEF against VBINX. The JdK RS-Ratio line had already picked up the emerging relative uptrend a few weeks early when it passed the 100-level in an upward direction.
IEF is expected to continue this relative move higher even if resistance in price cannot be taken out.
Equities / Bonds rotation
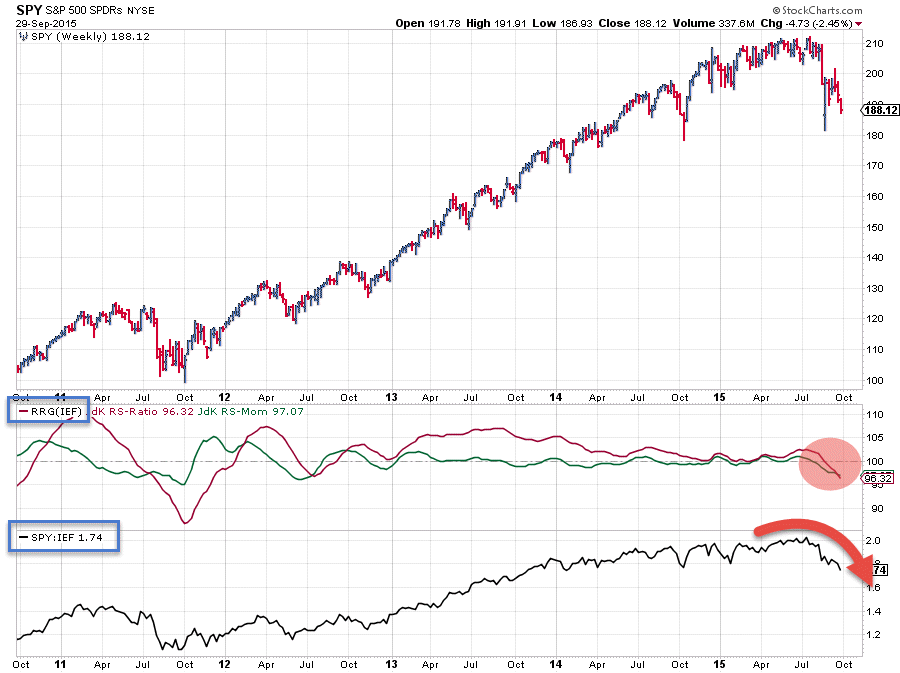
Resulting from the two individual analyses on IEF and SPY against VBINX within the asset allocation universe is the chart above which shows SPY (again) with the RRG-Lines and the relative strength line vs each other. This chart clearly shows the turnaround in trend for relative strength from favouring equities over bonds over the past years to favouring bonds over equities now. Let's keep an eye on this emerging move and see how long it lasts. On the Relative Rotation Graph SPY and IEF are moving in opposite directions with no change in momentum showing up for the time being.
Corporate bonds - LQD
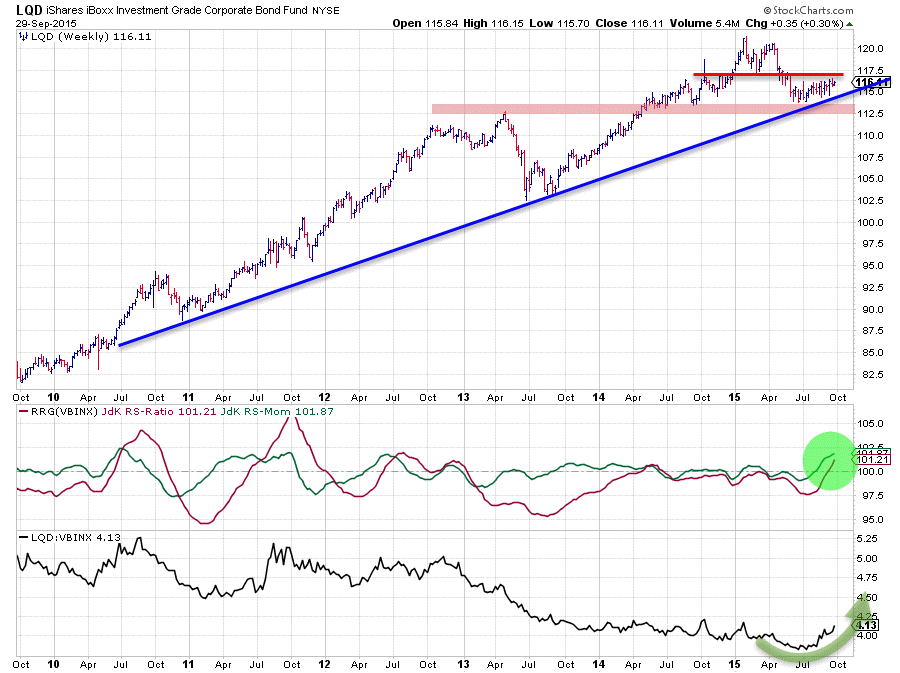
On the Relative Rotation Graph at the top of this article you can see that LQD moves very close to IEF inside the leading quadrant and is moving deeper into it at the same rate of change and a little bit behind on the RS-Ratio scale. Another very clear outperformer compared to equities (SPY). The price chart above shows LQD in combination with the RRG Lines and its relative strength line against VBINX. Similar to IEF, LQD also managed to hold up above the rising support line and seems to be putting in a new low and starting to move higher.
From a relative perspective the RS-Ratio has now convincingly crossed above the 100-level, indicating that a (new) relative uptrend is now underway following a period of sideways movement (performance more or less in line with the benchmark). On the price chart, there is some horizontal resistance expected around $ 117.50. This needs to be taken out to create more upside potential for a further rally towards the previous highs near $ 120. The relative outlook versus the other asset classes on the RRG is strong and this trend can be expected to continue over the next few weeks.
Real Estate - VNQ
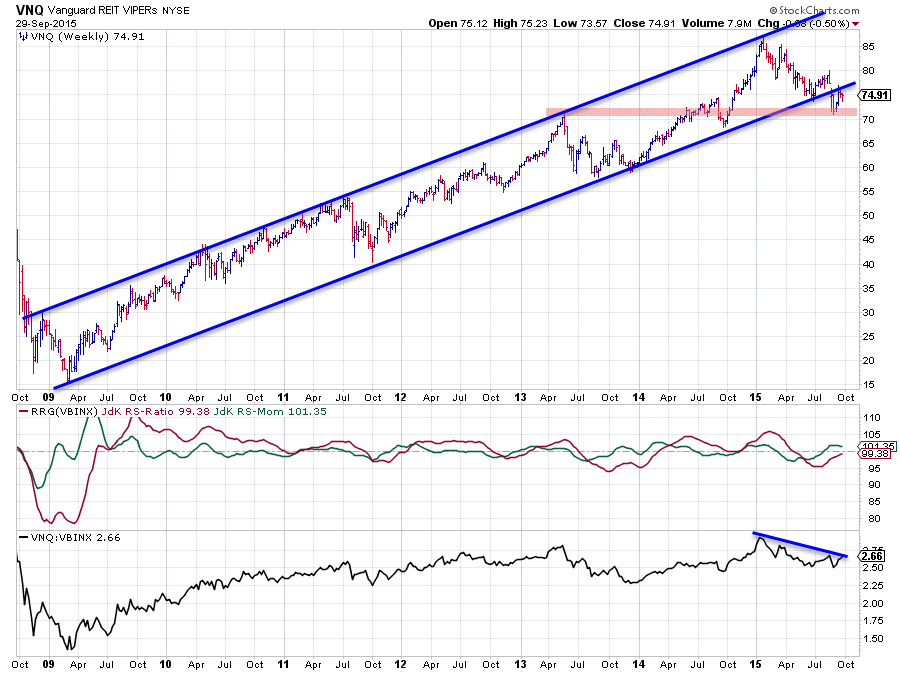
Over the past five years, VNQ went through some relative up- as well as downtrends as can be seen from the RS-Ratio line which moved above and below the 100-level for some prolonged periods of time. But all this time the price was contained within the boundaries of a gradually up-sloping channel. This situation changed recently when VNQ broke the rising support line of this channel in a downward direction, initially dropping towards roughly $ 70. The recovery rally out of this recent low now seems to be failing against the old rising support line which is starting to act as resistance. This means that support at $ 70 is now becoming very important. A break below that level will very likely trigger another round of selling and push VNQ further down possibly towards the support level around $ 65 and $ 60.
This development makes the recent pick-up in relative momentum a bit suspect. The RS-Ratio line has recovered to just below 100, but relative momentum (JdK RS-Momentum) is already starting to drop again. Combined with further weakness on the price chart this can cause a rotation of VNQ on the left-hand side of the RRG chart turning back down towards the lagging quadrant. This is usually a weak sign for the relative rotation and leads to further relative weakness, in this case against VBINX.
Conclusion
- SPY continues its underperformance versus VBINX and is challenging August support levels
- IEF confirms its new relative uptrend against VBINX and SPY
- Bonds, government and corporate, are taking the lead from equities
- VNQ seems ready to rotate back to the lagging quadrant
Julius de Kempenaer | RRG Research
RRG, Relative Rotation Graphs, JdK RS-Ratio and JdK RS_Momentum are registered TradeMarks by RRG Research


