Summary
- Big rotation among members of the Dow Jones Industrials Index
- DD came to life surprisingly strong
- CVX and UTX still expected to rotate back down again to lagging quadrant
- WMT, CAT and IBM all moving further into the lagging quadrant confirming their relative weakness
- UNH and AXP entering the danger zone
- MCD and GE strong inside leading quadrant
Initial observations from Relative Rotation Graph
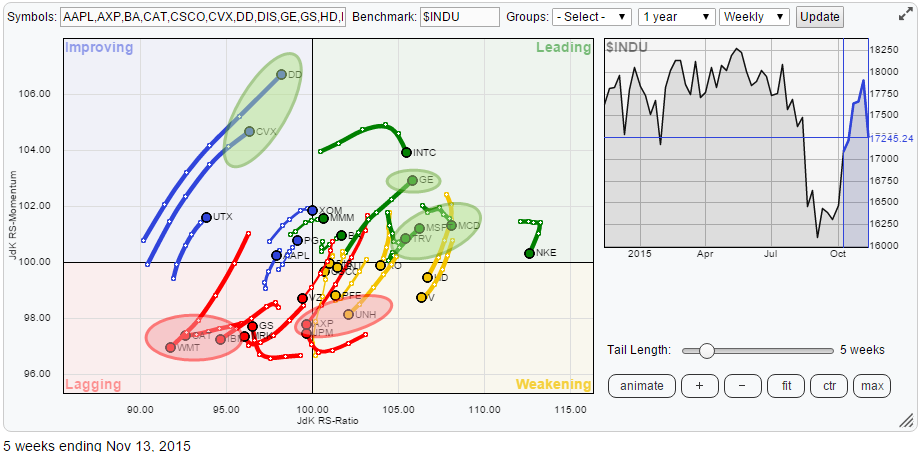
Looking at the Relative Rotation Graph holding the 30 members of the Dow Jones Industrials index some obvious areas of interest show up.
The first area is the improving quadrant where we find two, three, names with trails behind them. In my previous blog covering this universe, I labelled them as "dead cats bouncing"... Well, it looks like at least one of these cats came, or is coming, to life again.
Some very clear negative rotational pattern are visible inside the lagging quadrant. I am aiming at WMT, CAT and IBM and a bit higher on the JdK RS-Ratio axis AXP, just entered "Lagging" quadrant and UNH still inside weakening.
On the positive side, I am looking at GE, TRV and MSFT which all show a trail that is heading higher on both axes at a nice angle. Despite the loss of relative momentum over the past two weeks, MCD is still looking good from a relative point of view.
The RRG below is a cleaned up version holding only the names mentioned above as interesting to take a better look at.
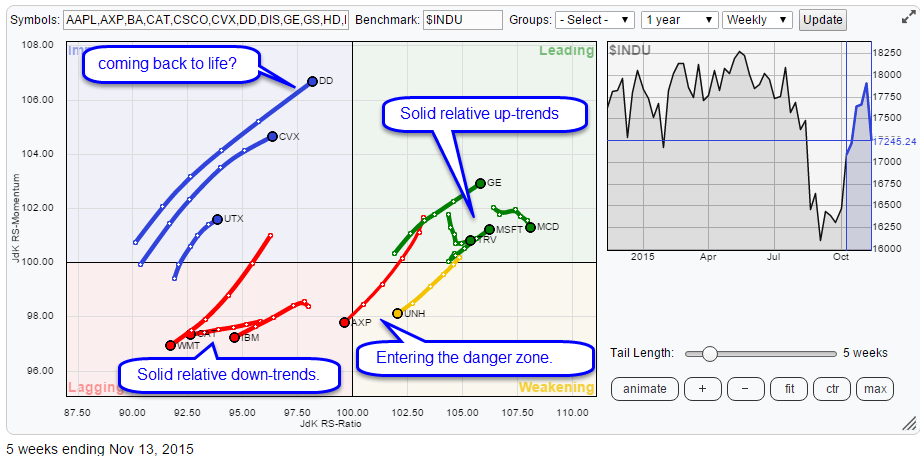
Dead cat coming to life again?
Inside the Improving quadrant DD, CVX and UTX require our attention as, especially DD and CVX, moved higher on both axes over the past 5 weeks while they had been labelled as dead cats bouncing in my previous blog on the Dow Jones Industrials universe.
DuPont Co. - DD
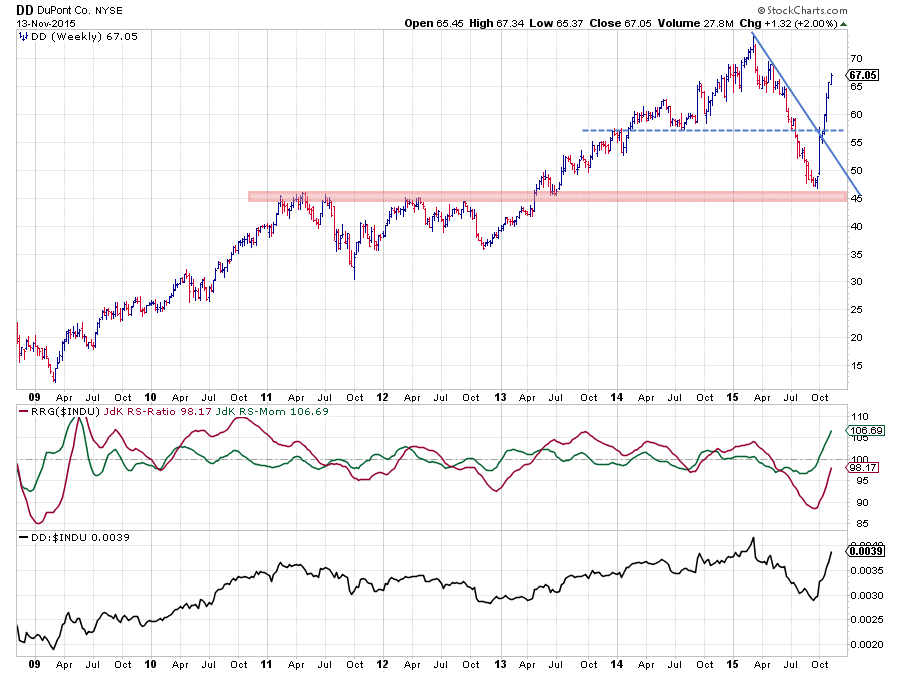
Wow .... that was some resistance near $ 57.50.... NOT!!
The $57.50 resistance level, coming off of the 2014 low, as well as the small peak during the transition from 2013 into 2014, was broken as if it was non-existing. The strong jump off the $ 45 base area proved to be much stronger than I expected. A rally of almost 50% within 7 weeks.. what can I say?
One thing has become clear, the down-move on the price chart as well as the downtrend in relative strength have come to an end. But what does it mean for future price and relative movement of DD? In situations like this that becomes a tricky call because our reference points on both the price and the relative charts have become void. Looking at the steep move of DD it is tempting to call for a corrective move down but this is one very strong move that could carry on a bit, much, longer. However, jumping on the train at this speed also does not look like a good idea. Annoying as it is I will have to accept that the train left without me for the time being. I will wait at the $ 57.50, no support, station and see if it is willing to pull-back and I will then decide if it is still worth getting onboard based on the situation on the charts at that time.
United Technologies Corp. - UTX
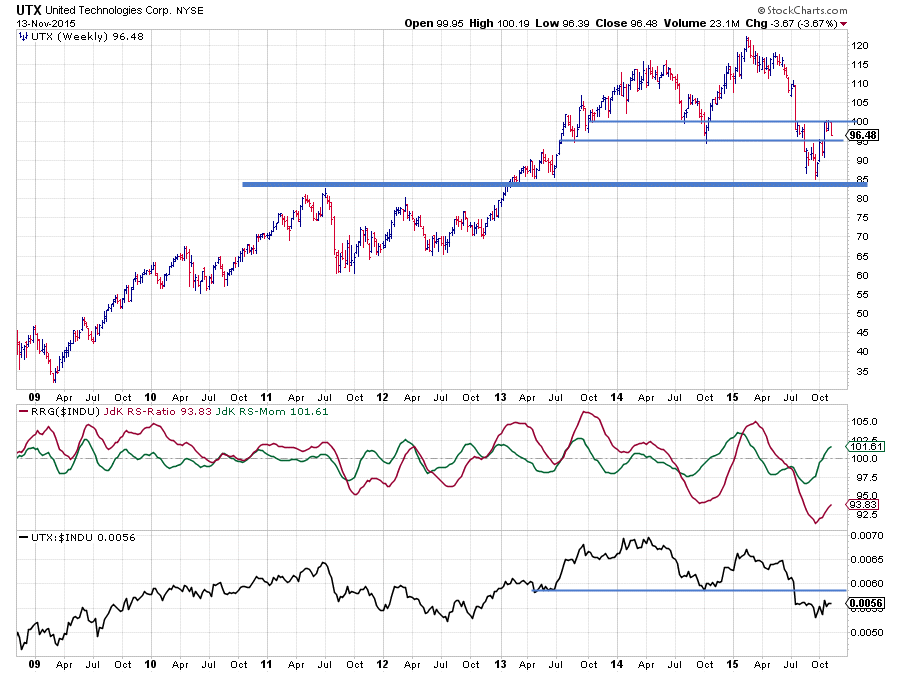
The other two stocks labelled as "dead cats" were UTX and CVX. They both rallied over the past few weeks but not even closely comparable to the price power shown by DD. At least UTX still looks very dead to me and I'm not so sure about CVX either. CVX pushed a little higher on the RRG chart but based on the combination of the price picture and the relative rotation there is still a very serious possibility for both to turn down to the lagging quadrant again before reaching leading.
I have picked the chart of UTX to show but the analysis for CVX is almost equivalent.
The move from the $ 120 peak down came to a halt at support in the $ 85 range. Out of this low a recovery rally materialised which now seems to be meeting resistance near $ 100. A small top formation was completed at last Friday's close suggesting that this level is actually playing its role.
On the relative charts the picture is fairly clear, the JdK RS-Ratio line dropped below 100 in June, signalling the start of a relative downtrend. This move was followed in July by a break of the RS-line below its horizontal support level. With the RS-Ratio line far away from the 100-mark and the raw RS-line just broken below support, the relative downtrend seems to be in full swing and closer to continuing its way lower rather than turning upward. IMHO still two dead cats bouncing.
Solid downtrends in lagging quadrant
Inside the lagging quadrant, we find three stocks in solid relative downtrends which are characterized by their trails moving lower on both the JdK RS-Ratio and the JdK RS-Momentum axes at a 255-degree angle (the opposite of 45 degrees inside the leading quadrant).
These stocks are WMT, CAT and IBM with WMT being in the strongest, longest and possibly most mature trend. CAT is resting just above an important horizontal support level while IBM has already dropped below its horizontal support and seems underway for a further drop.
Wal Mart Stores Inc. - WMT
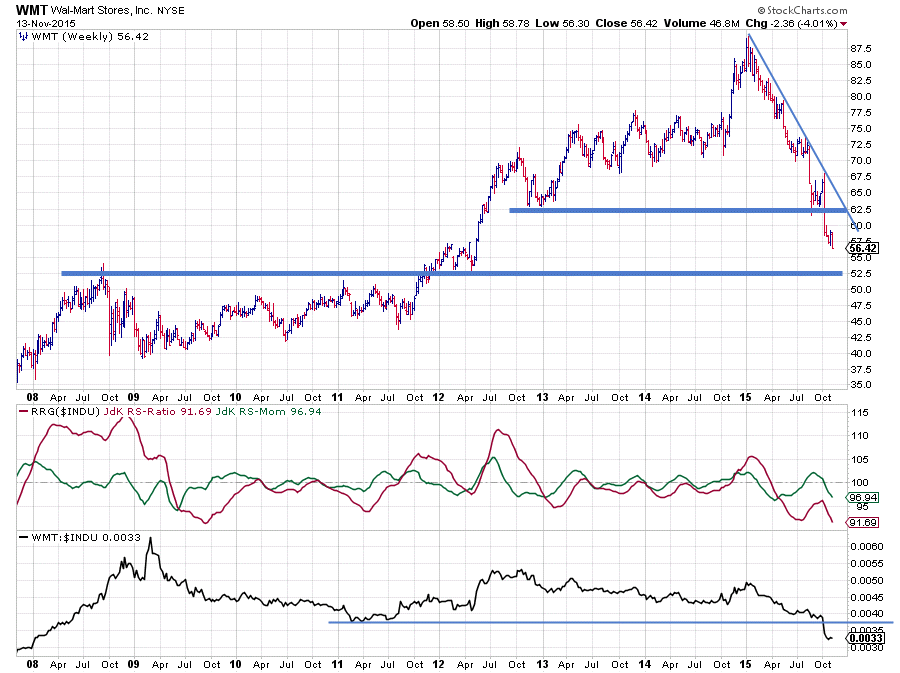
The downtrend in WMT is clearly present and has already taken the stock price from above $ 87.50 down to $ 57, an almost 35% drop. The recent violation of horizontal support near $ 62.50 only confirms the weak condition of this stock. Based on the price chart the next level to watch would be $ 52,50.
Relative strength has been week pretty much since late 2013 with short period of outperformance visible from late 2014 into the first few months of 2015. RS-Ratio dropped below 100 back in April, picking up the renewed relative downtrend. The recent drop of raw relative strength below its 2011 lows confirms that this trend is still fully intact.
Caterpillar Inc. - CAT
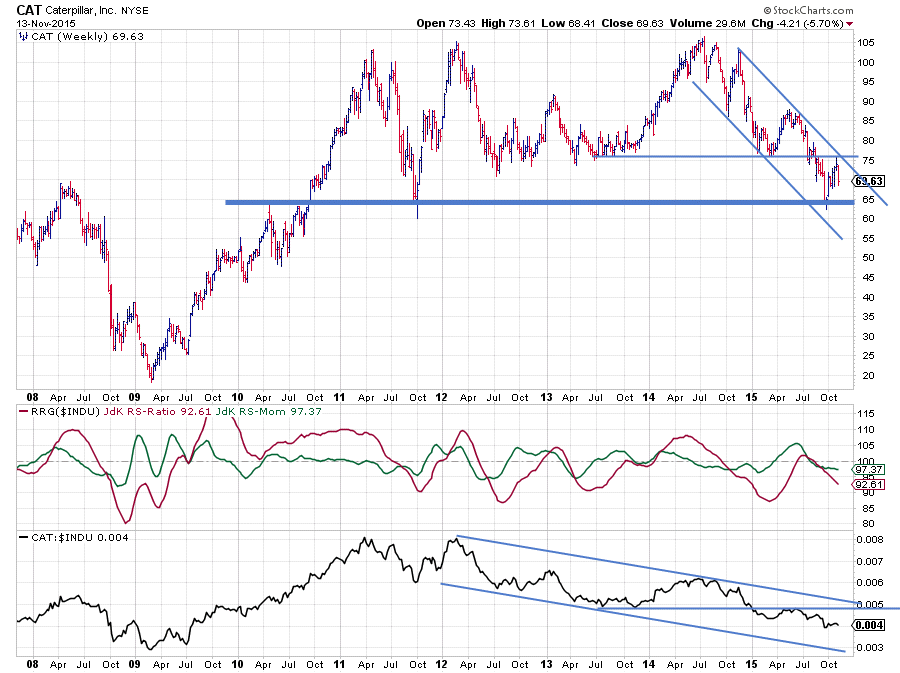
The flat period in raw RS during the first half of 2015 caused RS-Ratio to move higher and challenge the 100-level but the attempt was brief and in the end unsuccessful, the last turn down below 100 again confirmed that the relative downtrend is still underway.
On the price chart, CAT has good suport around $ 65. It will be interesting to see what is going to happen on the next test of this level. A break will clearly add more fuel to the relative (and price) downtrend. When this level manages to hold up it could be the beginning of a low being put into place with subsequent improvement of relative strength against INDU but for the time being I'll stick with the current trend which is pointing lower on both charts.
International Business Machines - IBM
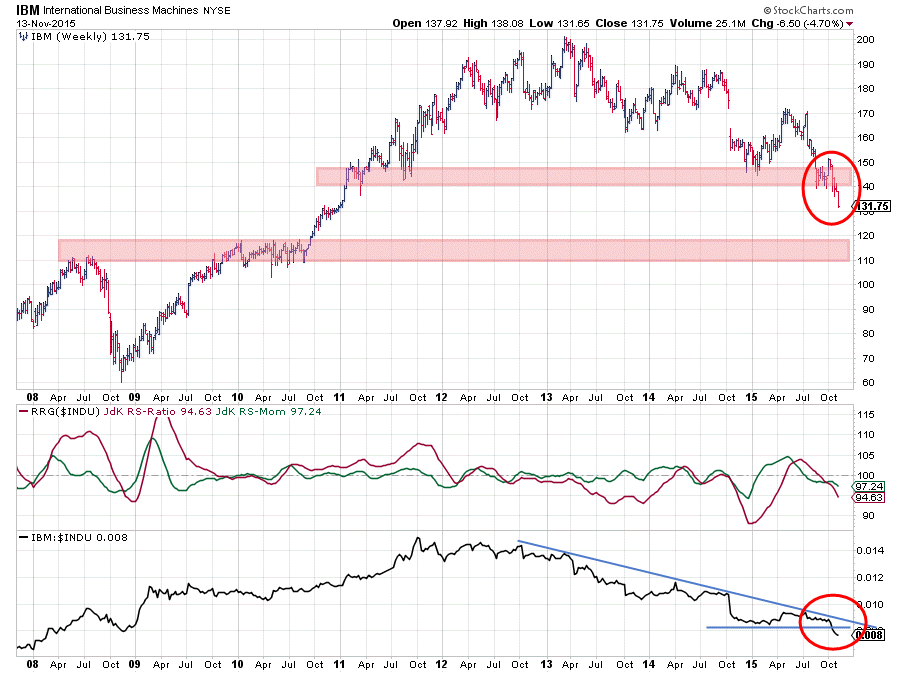
The IBM chart looks a lot like the CAT chart above with the only difference being that IBM already broke below its horiontal support (around $140) confirming the downtrend in price. The next level to watch on the way down is the area between $110-$120. This break in price also pushed the raw RS line below its recent low, opening up the way for more relative downside movement in relative terms as well.
Staying clear of IBM seems the smart thing to do for the time being.
Entering the danger zone
Further to the right on the RS-Ratio scale we find AXP and UNH. Both stocks are heading lower on both axes and AXP has just crossed over into the lagging quadrant while UNH is heading into that direction very rapidly showing a long trail.
United Health Group Inc. - UNH
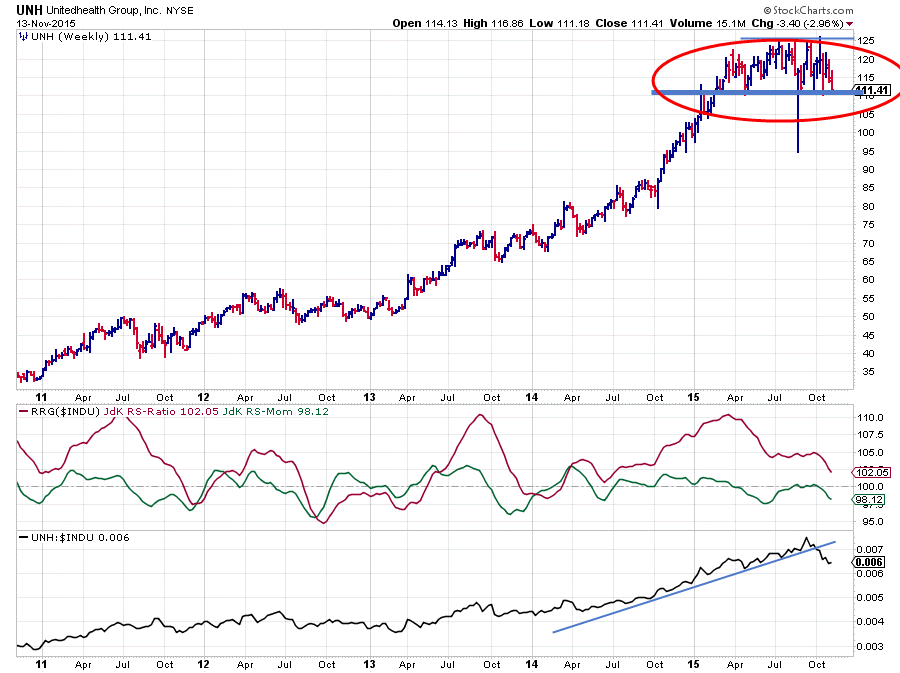
After a very strong run-up, UNH started to move sideways and form a distribution pattern between $ 110-120. At the moment, UNH is putting the lower boundary of that pattern to the test. A break below $ 110 will almost certainly lead to an acceleration lower.
On the raw RS-chart, the uptrend has been broken and started to move lower. The RS-Ratio is coming from a very high level and needs time to digest the change in relative trend, but RS-Momentum has been sending warning signals already and recently turned down again at the 100-level.
The combination of the threat of a break lower on the price chart and a turning trend in relative strength make UNH a dangerous play for the moment.
American Express Co. - AXP
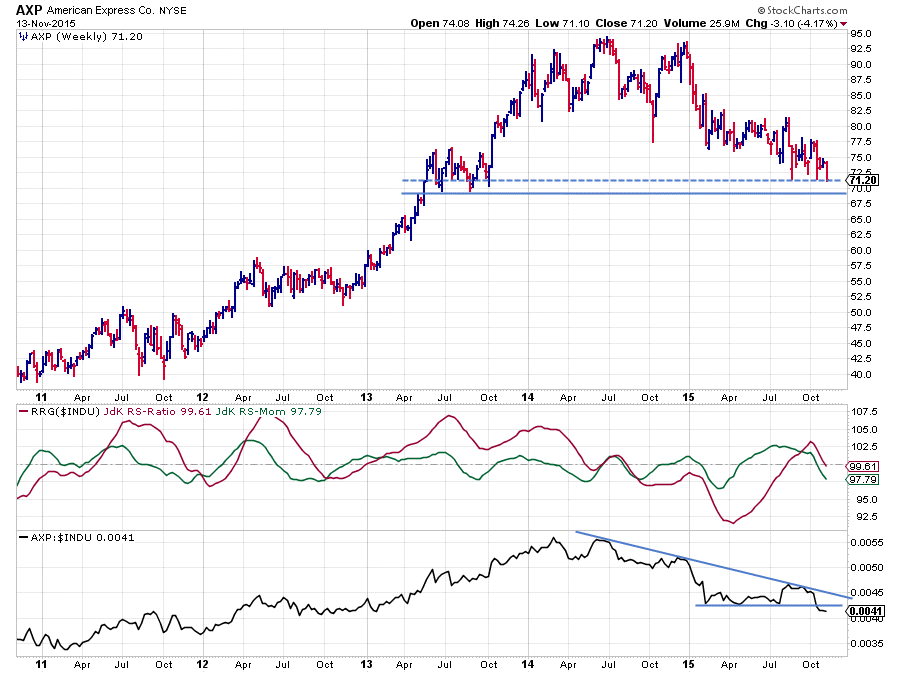
Just like UNH, AXP is resting at an important horizontal support level although the way AXP got there is quite different. Here a down move in price is already underway for quite some time and the support is offered by lows set in the mid of 2013. Nevertheless, a break below the area around $ 70 is expected to push AXP down even further.
On the relative charts, the picture is also quite different. Here the relative downtrend already started back in 2014 with the flat period in relative strength since the beginning of this year causing the RS-Ratio to move higher and briefly push above 100. This new uptrend in relative strength could not materialize and recently the raw RS-line took out its previous lows to the downside, re-instating the prior relative downtrend.
The push into the lagging quadrant will very likely accelerate upon a break of support in the price chart.
Some solid relative uptrend inside the leading quadrant
Despite all the negatives and caution signs that we've seen above there are definitely also some positives to be found inside the universe of the Dow Jones Industrials 30 stocks. The ones that I have highlighted on the Relative Rotation Graph at the top of this post are GE, TRV, MSFT and MCD. All are well inside the leading quadrant and still pushing higher on the JdK RS-Ratio axes. The only stock which has been losing a bit of relative momentum over the past few weeks is MCD.
McDonalds Corp. - MCD
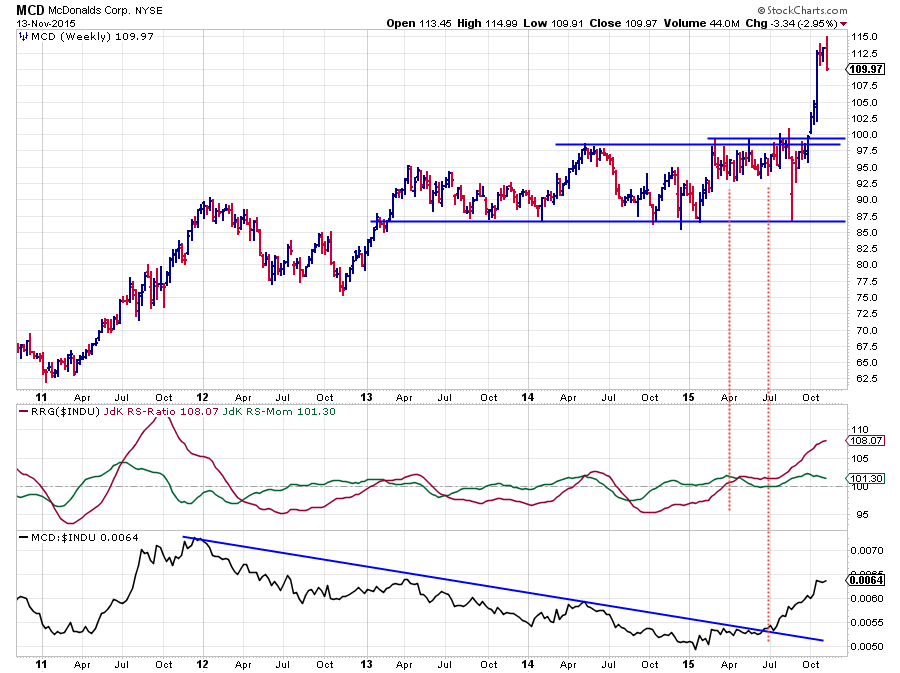
MCD was mentioned in my blog post from early September titled "Get a burger at MCD and help the stock stand out from the crowd" I guess a lot of readers actually went out and did that as the stock broke above the resistance area just below $ 100 and rallied strongly after that break.
The relative picture turned upward already in April when the JdK RS-Ratio line crossed above 100, followed by a break above the falling trendline on the RS-chart in June. The relative strength of MCD versus INDU continued to improve since then and pushed MCD deeper into the leading quadrant making it the second strongest stock based on RS-Ratio (NKE is still first). No doubt that this is a strong relative trend, backed by a strong price chart.
The short-term picture at the moment seems to call for some sort of setback. The RS-Momentum line came off over the past few weeks but also on the price chart a clear reversal is visible. This could lead to some price and relative weakness in coming weeks with good support around the former resistance level at $100. Given the overall strong picture, any such a pull-back looks to be a renewed buying opportunity.
General Electric - GE
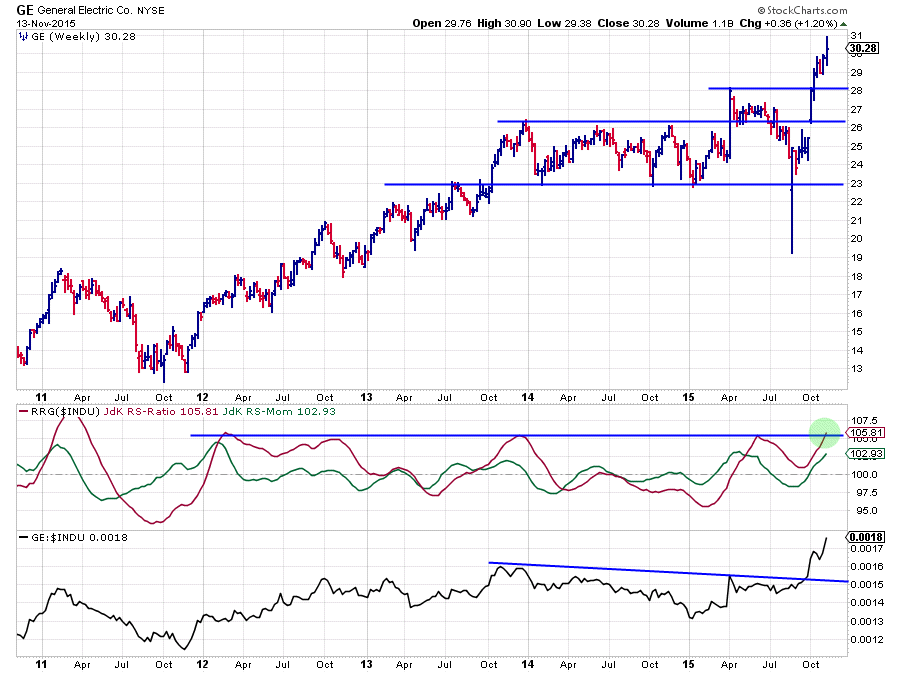
After a two year uptrend in price (2012 and 2013) GE started moving sideways in a range between $23-26 causing the relative strength against INDU to gradually drop. The first improvement occurred in April when price jumped tp $28 breaking out of the range. That move caused RS to jump with it, breaking the downtrend since late 2013 and turning the RS-Ratio line above 100 starting a new relative uptrend. That initial break did not get any follow thru in price as the stock fell back within the range again. The relative strength trend however, continued to improve and could maintain RS-Ratio levels above 100.
The second jump occurred in the beginning of October with more success as price continued to rally and is now pushing to new highs every week. The next serious test will be in the area around $32-32.50 where horizontal resistance is found coming off of the 2007 high as well as a cluster of highs and lows in 2000-2001. For the time being GE looks to be able to continue its outperformance of the Dow Jones Industrials index.
Julius de Kempenaer | RRG research
RRG, Relative Rotation Graphs, JdK RS-Ratio and JdK RS-Momentum are registered TradeMarks by RRG research.
