RRG Charts January 31, 2019 at 12:27 PM
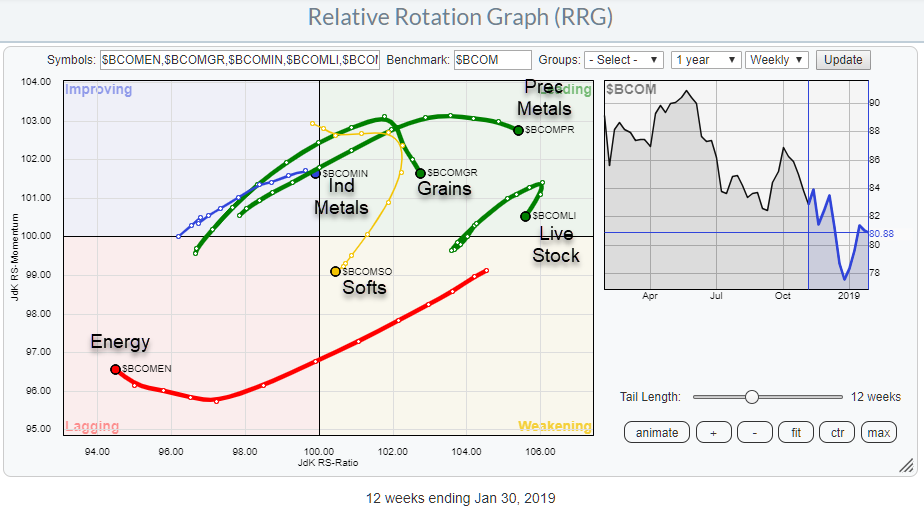
In this article, we are going to take a look at commodities using Relative Rotation Graphs and the Bloomberg commodity index family. When possible, I prefer to use data-sets that come from the same family and creating a "closed universe... Read More
RRG Charts January 24, 2019 at 11:38 AM
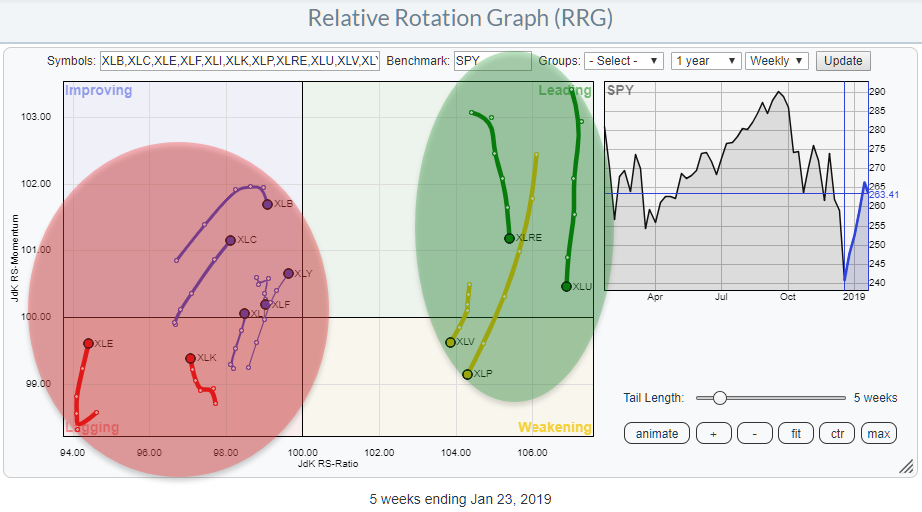
The Relative Rotation Graph for US sectors is showing a split picture. On the right, we have Utilities, Real-Estate, Consumer Staples and Healthcare. With the exception of Real-Estate maybe, these are generally accepted as "defensive" sectors... Read More
RRG Charts January 17, 2019 at 05:42 PM
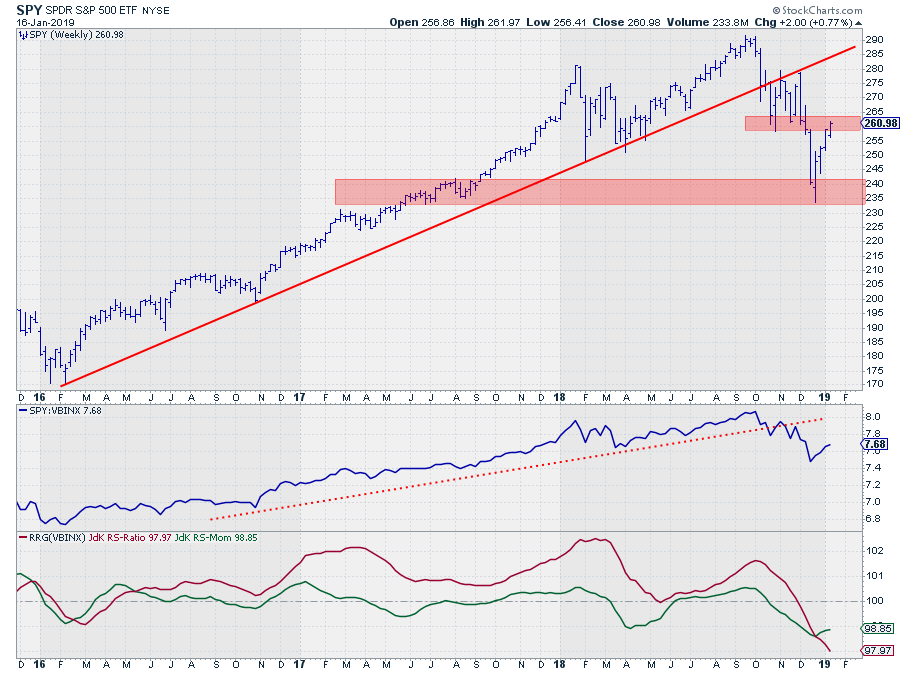
After the sharp sell-off in Q4 of last year, the market (SPY) started to recover from its lows near 235. And IMHO it is still a "recovery" before turning down again as opposed to a "turnaround" back up... Read More
RRG Charts January 11, 2019 at 11:53 AM

It's Friday morning in Amsterdam and I just dropped my daughter off at school. On the way to my office, I usually stop at the local Coffee Company for a cappuccino and reading some, market-related, news, blogs etc... Read More