 First of all, let me say that I really appreciate any feedback and comments I get on any of my articles, either via DISQUS below each blog post, via email or in SCAN. I do read all of them and I try to answer most of them, I think my response rate is above 90%. So if I have missed yours, just ping me again.
Just being polite is one reason to answer, even if the answer is "sorry I cannot answer your question." But, more importantly, the interaction with readers is fun and sometimes thought-provoking. And, on a regular basis, these exchanges of thoughts provide ideas for future articles. When that happens, I know that there is at least one person out there that likes or is interested in that article. ;)
The Article
In this case, the question was about my article in last week's ChartWatchers newsletter: "Can I have Coke (KO) With My Big Mac (MCD) Please?". In that article, I highlighted both Coca-Cola and McDonalds as potentially interesting stocks inside the Dow Jones Industrials Index.
The Question
In the DISQUS section below the article, Ron asked the following question:
"Would you suggest to own the entire EFT of a leading sector like XLP, individual high performing stocks within the ETF (like KO) or both (XLP and stocks within it like KO and KHC)?"
When I sat down to answer that question, initially in DISQUS, I quickly realized that my answer was beginning to look like a full-fledged article on the subject. That was probably because it is something that I have spent quite a bit of time on in the past and because it is something that really has my interest. Also, there are soooo many different ways to answer this question.
So instead of pushing my answer into the DISQUS comment, I decided to elevate it to an article.
(Technical) Market Analysis vs Portfolio Construction
The question, in this case, was related to my observation of KO, a Consumer Staples stock, being a potential outperformer and how to deal with that, given the general strength of that sector as a whole.
For me, this question is (very) separate from answering questions about market direction, which is what we mostly do as (technical) analysts. Is the S&P going up or down? Will Technology break out? Will Utilities outperform? Will KO outperform the DJ Industrials Index?
All these questions have to do with the analysis of markets, indexes, individual stocks, sectors, etc. and we can come up with answers or expectations or opinions by following an analysis process. That's the job of an analyst. How to translate these findings into a position or, even more importantly, a portfolio is a completely different ball-game.
To answer this question, one would need to know things about the risk-appetite of the investor, the size of the portfolio, the goal of the portfolio and any restraints that may be in effect for that portfolio. Following these inputs, a decision needs to be made about the size of the position to buy or sell relative to the overall size of the portfolio, etc., etc. All of that is the job of a Portfolio Manager (PM).
There is a good reason why these jobs and disciplines are separated in big asset management firms, as they really are different jobs.
To make it even more complicated, there is even a third role in the professional AM business, that being the role of the trader. He or she will eventually execute the trades following the analysis from the analyst and the size determined by the PM.
(For private investors, all these three roles are combined into the same person, which is often not very easy!)
General Approach
For me, the big guidelines to answer such a question starts with an approach from a risk perspective. In general, the risk associated with an ETF, which is, in essence, a basket of stocks, is less than the risk associated with a single stock.
Closely associated with risk is return, as we all know. To put it simply, the chances for double-digit % moves, either up or down, are bigger for single stocks than for an ETF.
So, what do you, as a private investor, want to do? Are you looking for a stable portfolio with a decent return? Or are you looking to shoot out the lights with a concentrated portfolio in single stocks and don't mind the risks that come with that approach?
The problem is that a lot of people want the returns of the "shoot out the lights" approach with the risk of the stable diversified approach. Unfortunately, it does not work that way. It's the 64 million dollar question that nobody has answered yet. If you happen to find the answer, please send me a direct message. ;)
Some ideas to implement a view
To answer Ron's question a little bit more to the point, here's my view, going based on the premise that we do like the Staples sector at the moment and that we do want to allocate part of our equity portfolio to one or more positions that give us exposure to that sector. To keep things relatively simple, I am going to assume that we benchmark ourselves against the S&P 500, or maybe absolute return (>0%).
There are a few things that we can do.
- We could simply buy the XLP ETF. This gives us exposure to all stocks in the Consumer Staples sector. The benefit is that we do not have to worry about individual stock selection, nor do we run the risks associated with single names. The drawback is that we do not fully benefit when a single stock, like KO for example, really takes off.
How much we want to allocate to XLP is a secondary question. At the moment, the weight of XLP in the S&P 500 is 7.5%. So, if we own 7.5% of XLP in our portfolio, we are at "market weight," meaning that our holding in XLP will attribute to the bottom line just as much as it will attribute to the return of the S&P 500. As we like the sector, that is not what we are looking for. In order to do better than the S&P 500, we need to allocate more than 7.5% of our portfolio to XLP. How much more? Again, that's a function of risk appetite - the more you allocate, the more you will benefit from a good performance of XLP, but the more you will get hurt when XLP goes the other way. Holding more than 7.5% of XLP creates an "overweight" position, which is what we want to have when we like a sector.
When you are looking for absolute returns, the amount you hold could be a function of the number of positions you hold in your portfolio, such as 20 positions of 5% each. In that example, you need 5% of XLP.
- When you have a particularly strong view on one or more stocks in a sector, but still want to mitigate the associated risk, you can combine buying the ETF with single stocks. In the example at hand, we could look to combine XLK with KO and KHC. By the way, KHC would be a pretty aggressive bet given its very low position on the JdK RS-ratio scale. It's a good way to add a little spice to a general holding in XLP.
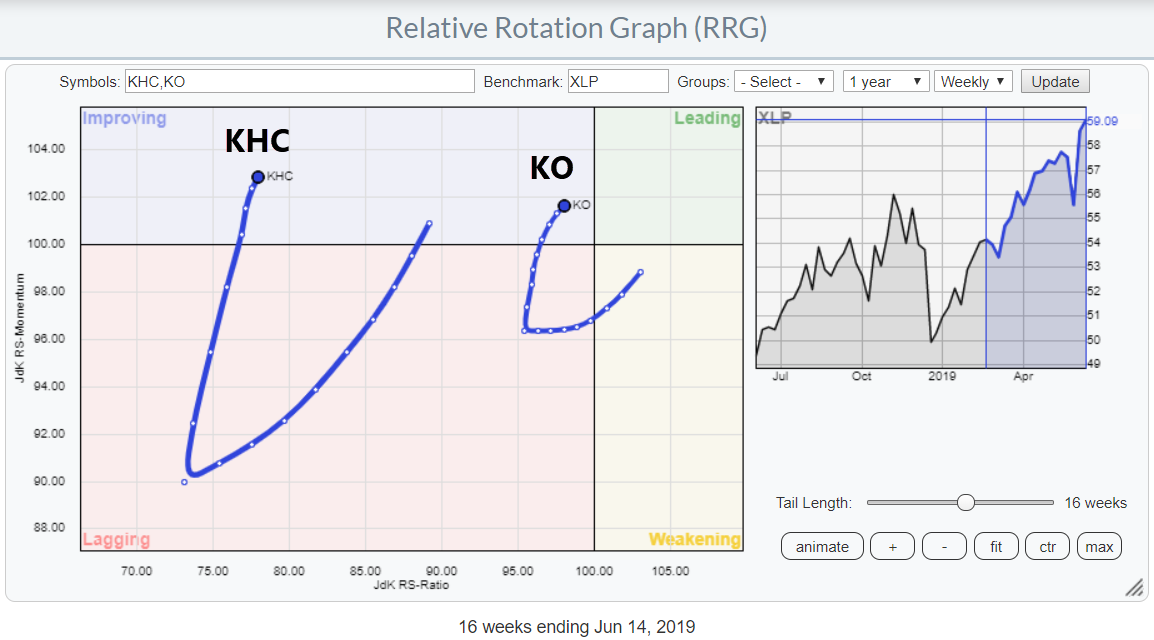 Again, our starting point is the 7.5% weight for XLP in the S&P 500. In order to "translate" a strong view for KO and KHC inside XLP and a strong view for the sector as a whole, you could buy 7.5% in XLP, which gives you a market weight position, and then add (for example) 1.25% in both KO and KHC, which brings the total exposure to the Staples sector at 10% (7.5+1.25+1.25). Clearly, the higher the % per individual stock, the higher the risk..
What you will end up with is an overweight position in the Staples sector with overweights for KO and KHC versus XLP. This will benefit us when KO and KHC will indeed outperform XLP but if they don't we won't get hurt too much as the bulk of the position is still in the ETF that covers the entire sector. Assuming the sector will be able to hold up of course. - The more risky - but potentially more rewarding - approach would be to buy one or more Consumer Staples stocks, up to a total weight up to or over 7.5% of your total portfolio value. The more concentrated (fewer stocks) your positions, the higher the risk, and you may or may not be shooting out the lights. ;)
This is clearly the riskiest approach and it needs constant attention from the owner of the portfolio. This is not a strategy/approach that you can run in the weekends and then forget about during the week. This needs work.
- As a final option, I'd like to give you a variation on the combined approach described under 2 to consider. As previously stated, you can create a position that gives you exposure to the sector with overweights in one or more stocks on which you have a strongly positive view.
But what if you are positive on a sector but have a strongly negative view on a few stocks in that sector? If you have the option of short-selling in your portfolio, or you can create a negative delta for individual stocks, you may consider buying the ETF, but then creating short positions for the stocks you do not like in that sector, either through straight short-selling or via options.
What that means is that you will end up with an overweight position for the sector but underweight (or no positions) for a few individual stocks. As the holdings for each (sector) ETF are known, you can calculate how much shares of a particular stock you will need to short to offset the holdings of that stock inside the ETF.
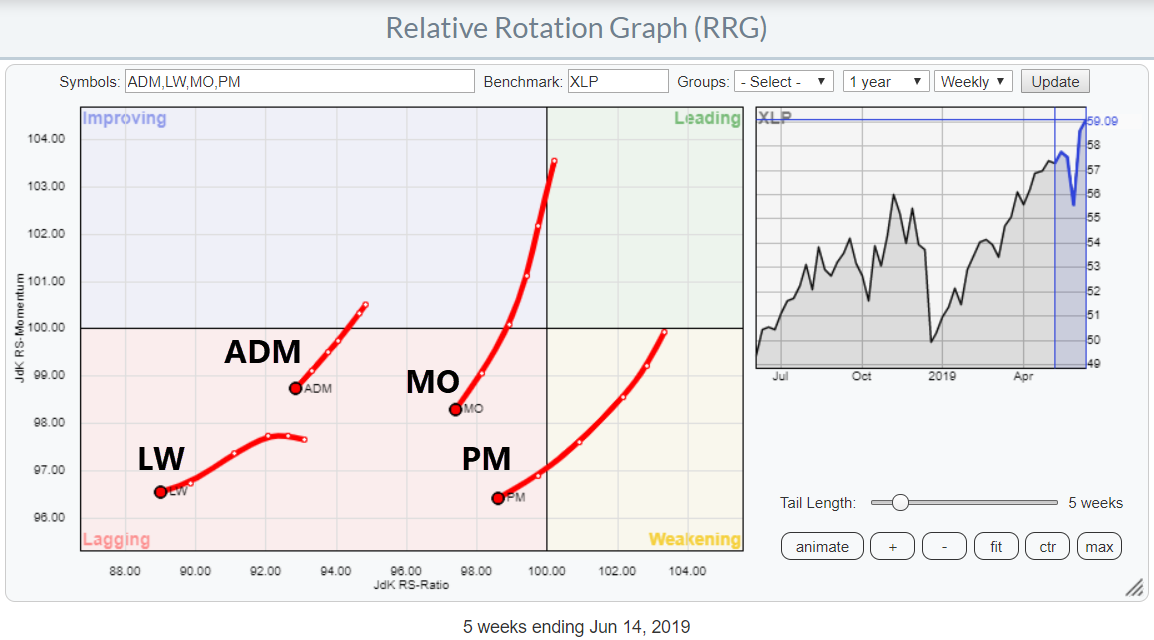
With regard to the Staples sector at the moment, the RRG below shows a few names belonging to the Staples universe that could be candidates to avoid while the sector as a whole is outperforming the market.
I hope you liked this intermezzo from the usual market analysis as an answer to a seemingly simple question. Please, keep the questions coming, as it is much more fun to write and share my thoughts on subjects that I know people are interested in.
Let me know what you think of this usage of RRG in the comments below. If you would like to receive a notification when a new RRG Charts blog article is published, simply subscribe with your email address using the form below.
Julius de Kempenaer
Senior Technical Analyst, StockCharts.com
Creator, Relative Rotation Graphs
Founder, RRG Research
Want to stay up to date with the latest market insights from Julius?
– Follow @RRGResearch on Twitter
– Like RRG Research on Facebook
– Follow RRG Research on LinkedIn
– Subscribe to the RRG Charts blog on StockCharts
Feedback, comments or questions are welcome at Juliusdk@stockcharts.com. I cannot promise to respond to each and every message, but I will certainly read them and, where reasonably possible, use the feedback and comments or answer questions.
To discuss RRG with me on S.C.A.N., tag me using the handle Julius_RRG.
RRG, Relative Rotation Graphs, JdK RS-Ratio, and JdK RS-Momentum are registered trademarks of RRG Research.


