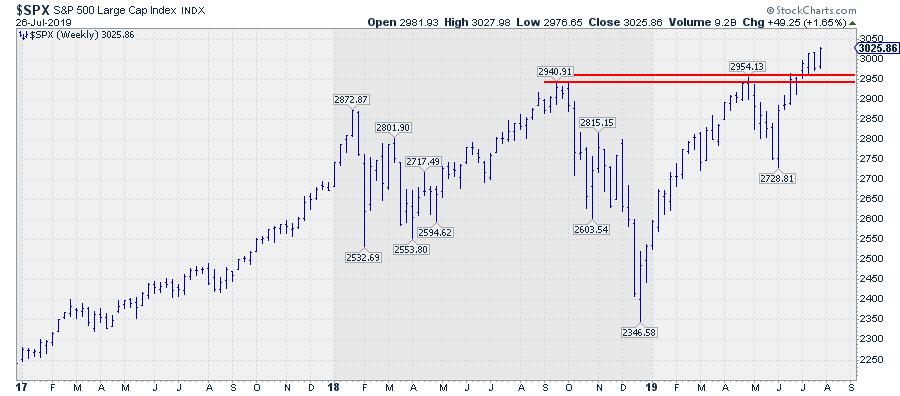
In the run-up to its resistance level (around 2950), along with first two weeks after breaking that barrier while pushing to new highs, more defensive sectors like Utilities and Consumer Staples were leading the market higher.
The situation is changing now, adding more reliability to this important breakout.
RRG Positions In the Run Up To and Shortly After Breaking Resistance
The Relative Rotation Graph below shows the positions of the various sectors at the beginning of July. Utilities, Staples and Real Estate are all inside the leading quadrant and heading at positive RRG-Headings. Health care is inside the improving quadrant, but is rapidly gaining on the JdK RS-Momentum scale and moving towards the leading quadrant.
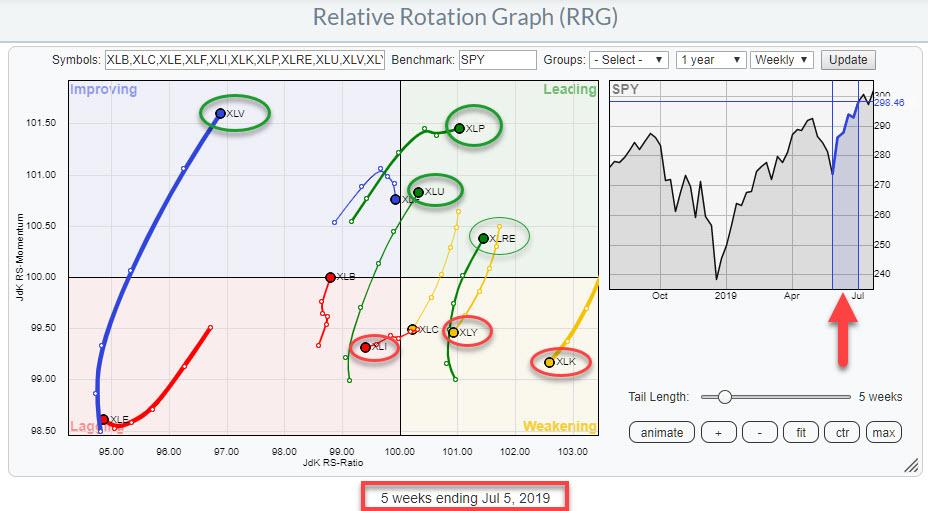 RRG positions on 7/5/2019
Please note that this RRG is showing the situation on 7/5/2019. You can reproduce this image by going to the RRG page, loading the pre-defined universe for US sector ETFs and, lastly, moving the date slider left to go back in time.
The slider can be moved either with the mouse or by using the left- or right-arrow keys - the date-stamp below the image will change accordingly.
Actual RRG Positions
Bringing the RRG back to the current date shows that, in the last three weeks (just after the S&P 500 broke above its resistance), sector-rotation has started to take place, with tails beginning to roll over or curl up.
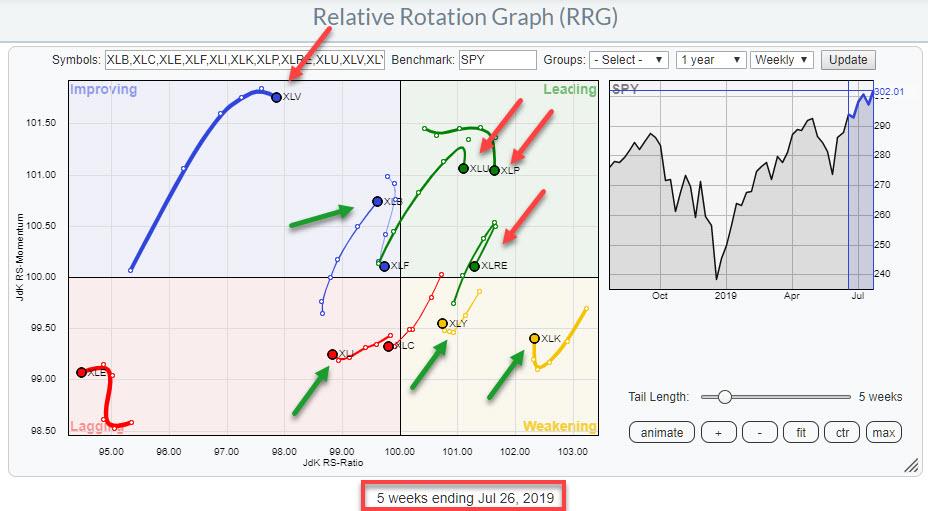 Actual RRG positions
The arrows in the RRG above show that the defensive sectors, which had led the way higher until the start of July and into the breakout, have now started to roll over. Inside the leading quadrant, all three sectors (Utilities, Staples and Real Estate) are now moving lower on the RS-Momentum scale , indicating a loss of strength in their relative (up)trends.
Health Care, inside the improving quadrant, has started to give way as well; it doesn't look as if that sector will be able to make the rotation towards the leading quadrant in coming weeks.
More offensive sectors inside the weakening quadrant, like Technology and Consumer Discretionary, have started to curl up, and their tails are now pointing towards the leading quadrant again.
Inside the improving quadrant, the Materials sector is now rapidly heading towards leading and is expected to enter that quadrant in the next week(s).
A very early indication is given by the small upward rotation for the Industrials sector, which is still well inside the lagging quadrant. The low RRG-velocity (distance between week-week observations) indicate that downward power has decreased in the last weeks, making it easier to turn back up.
Upward rotations that take place inside the weakening quadrant always have my attention, as these are already established relative uptrends that are about to embark on a second (or third, or fourth, etc.) leg of that trend. In this situation, that means looking at Discretionary and Technology.
Consumer Discretionary - XLY
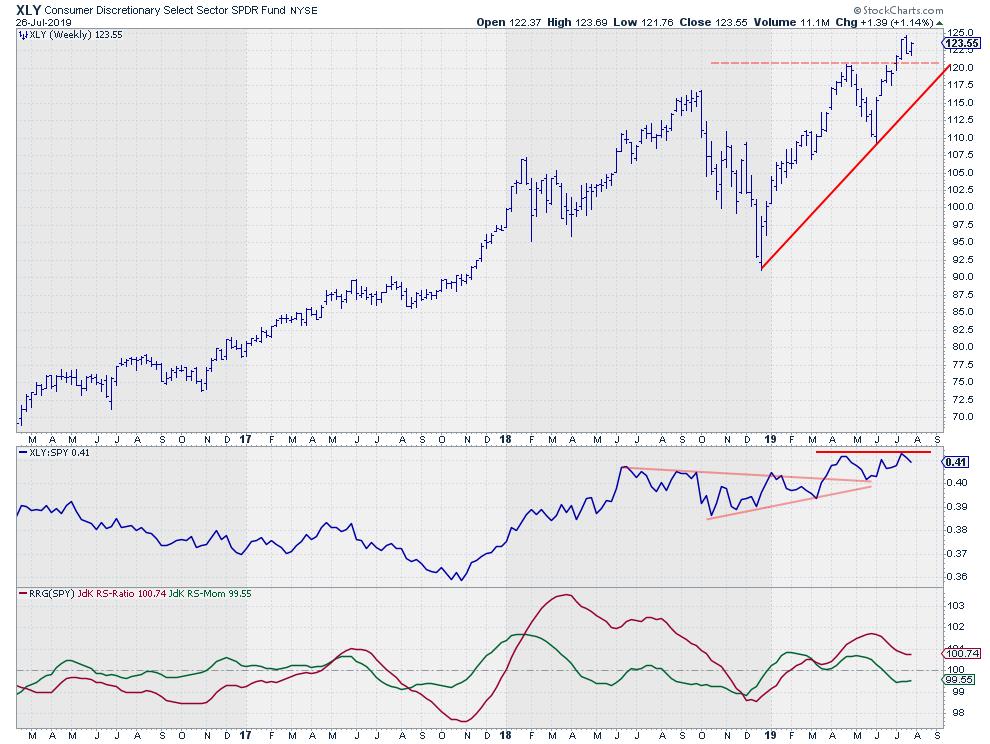
The RS-Line for XLY broke out of a triangle formation at the end of March, but ended up in a sideways consolidation, creating an overhead resistance level that is now weighing on the market. The upward break in the price chart will very likely support a move higher in relative strength, which will push the sector back into the leading quadrant. This will make it one of the sectors leading the S&P 500 higher in coming months.
Technology - XLK
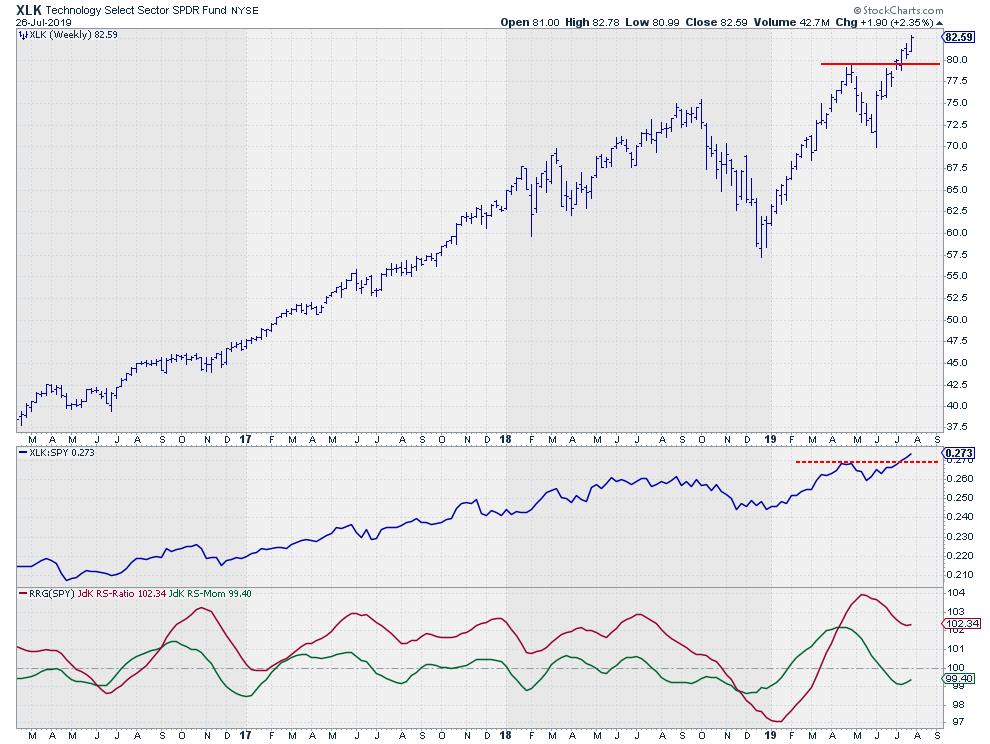
The Technology sector, despite its position inside the weakening quadrant, is still the strongest sector based on JdK RS-Ratio. After a small dip from April to June, the sector is now gaining again on both axes of the RRG, fueled by the break to new relative highs combined with a similar break on the price chart.
At the start of July, I wrote an article for the ChartWatchers newsletter titled "The S&P Just Broke Out of a Two-Year Consolidation, But There are Still Some Pockets of Concern". At least one of these concerns (No. 2 defensive rotation) has now been cleared.
Can you find, or do you think (some of) the other concerns have been overcome as well?
Let me know what you think of this usage of RRG in the comments below. If you would like to receive a notification when a new RRG Charts blog article is published, simply subscribe with your email address using the form below.
Julius de Kempenaer Senior Technical Analyst, StockCharts.com Creator, Relative Rotation Graphs Founder, RRG Research
Want to stay up to date with the latest market insights from Julius?
– Follow @RRGResearch on Twitter – Like RRG Research on Facebook – Follow RRG Research on LinkedIn – Subscribe to the RRG Charts blog on StockCharts
Feedback, comments or questions are welcome at Juliusdk@stockcharts.com. I cannot promise to respond to each and every message, but I will certainly read them and, where reasonably possible, use the feedback and comments or answer questions.
To discuss RRG with me on S.C.A.N., tag me using the handle Julius_RRG.
RRG, Relative Rotation Graphs, JdK RS-Ratio, and JdK RS-Momentum are registered trademarks of RRG Research.
Julius de Kempenaer
Senior Technical Analyst, StockCharts.com
Creator, Relative Rotation Graphs
Founder, RRG Research
Host of: Sector Spotlight
Please find my handles for social media channels under the Bio below.
Feedback, comments or questions are welcome at Juliusdk@stockcharts.com. I cannot promise to respond to each and every message, but I will certainly read them and, where reasonably possible, use the feedback and comments or answer questions.
To discuss RRG with me on S.C.A.N., tag me using the handle Julius_RRG.
RRG, Relative Rotation Graphs, JdK RS-Ratio, and JdK RS-Momentum are registered trademarks of RRG Research.


