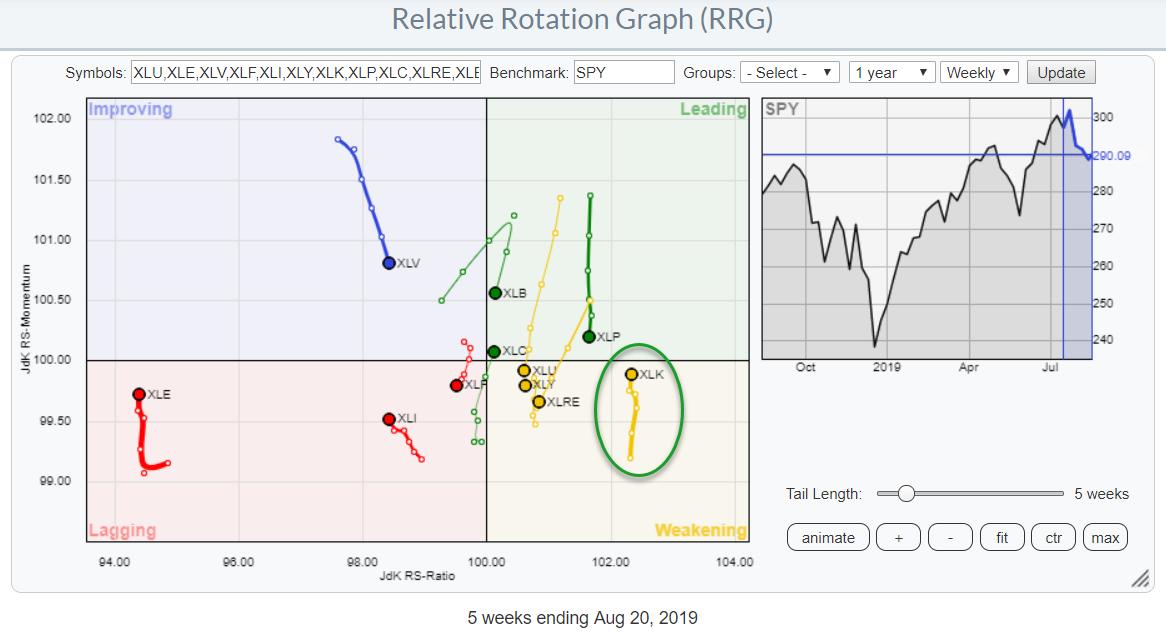
On the weekly Relative Rotation Graph, the Technology sector is currently inside the weakening quadrant, but is moving almost vertically up towards the leading quadrant. That is to say, it's moving back to the leading quadrant, as it already completed a strong rotation through that leading quadrant from xxx to xxx.
Measured on the JdK RS-Ratio scale, XLK remains the strongest sector, and the turn back up towards the leading quadrant is positive as it usually signals a continuation of the previous (relative) trend.
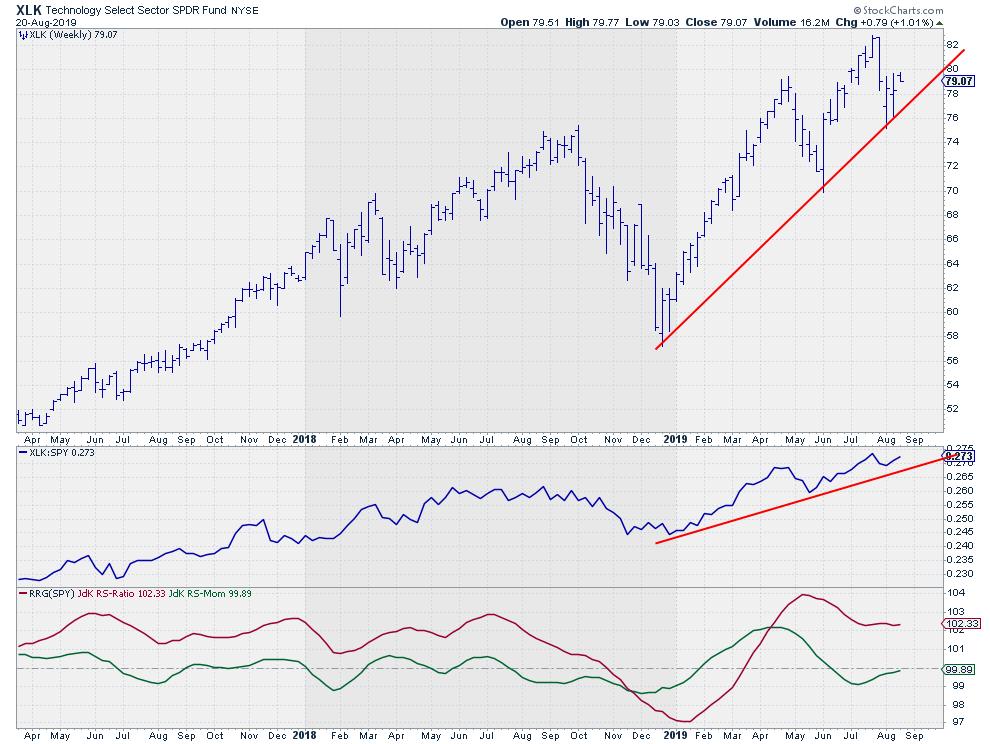
This comes back on the weekly chart above, where the rhythm of higher highs and higher lows is still intact on both price and relative.
The dip in relative strength in May caused JdK RS-Momentum to drop below 100 and drag the RS-Ratio lower, though never below 100. Currently, RS-Momentum is crawling back above 100 again, indicating renewed relative strength. A push to new relative highs will be a confirmation of this renewed strength.
The Daily Image
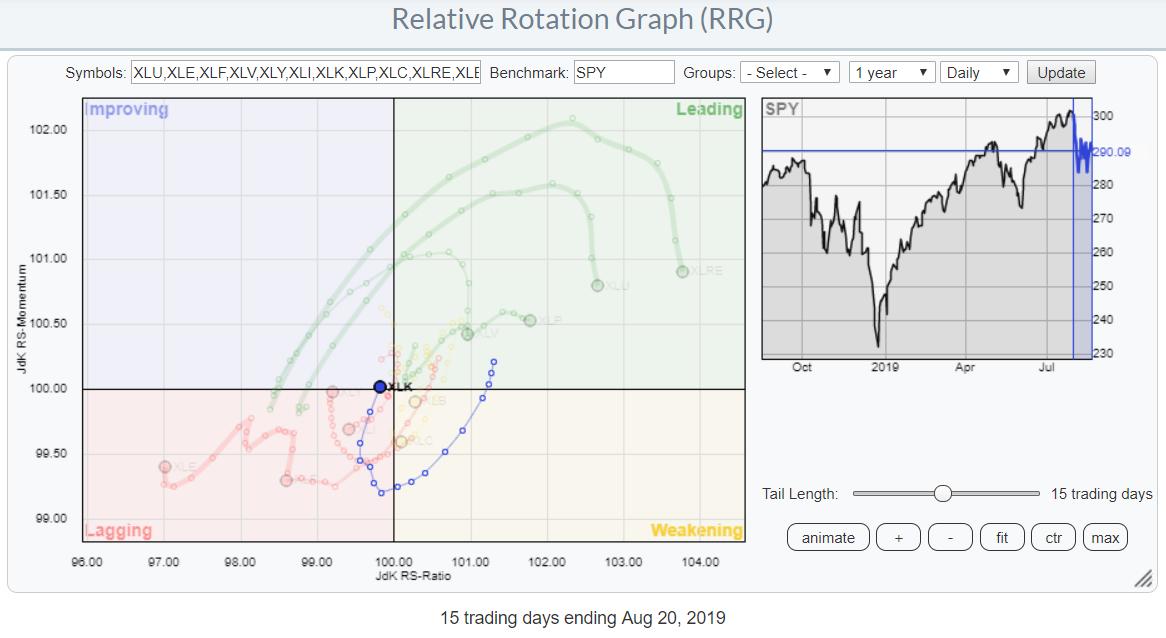
On the daily version of the RRG, we see that temporary weakness in relative strength translated into a rotation from leading to weakening, then through lagging and now back into improving. In particular, the rotation over the last three to four days is encouraging, as the tail started to move toward a positive RRG-Heading (between 0-90 degrees). This rotation supports the strength seen on the weekly RRG.
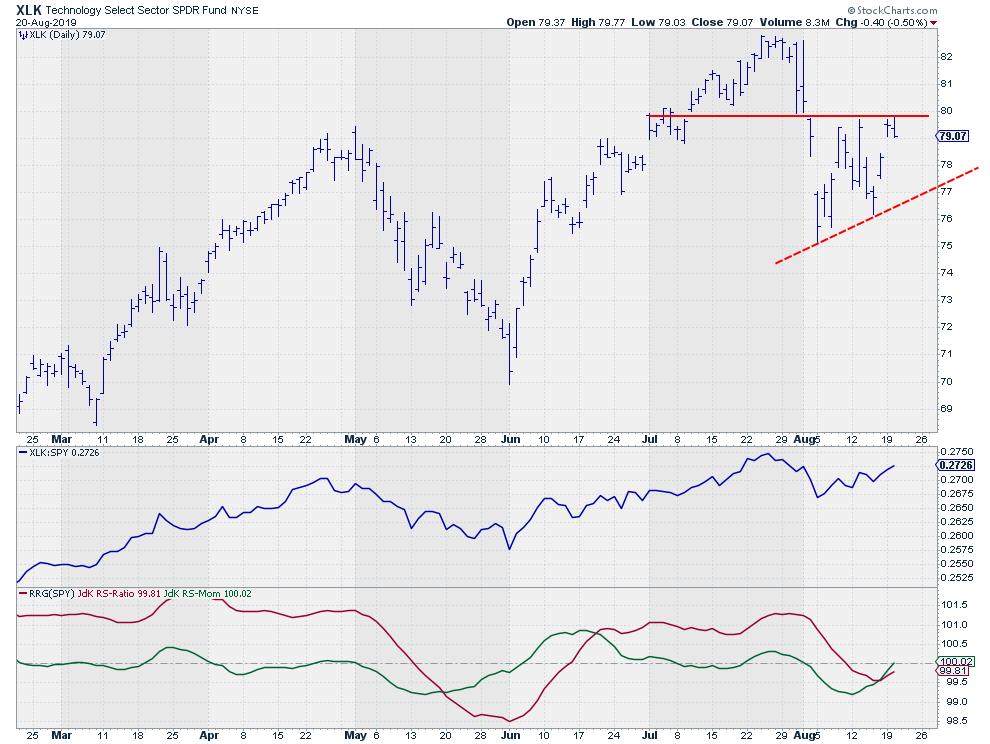
On the daily chart of XLK, the area around $80 is showing up as resistance while the most recent low came in at a higher level. This indicates that buyers are eager to come back, another sign of strength.
The confirmation will come when resistance around $80 can be taken out and relative strength can move beyond its most recent high on the daily chart.
Semis Are Looking Strong!
You can easily pull up an RRG that shows all constituents of the Technology sector with XLK as the benchmark. StockCharts subscribers can click on this link to bring up that chart.
When you bring up an RRG, there is a table below the chart. One of the things you can do with that table is select the individual rows, which will highlight the tail of that security while dimming the others. This is very useful for studying the tails of the individual stocks on the chart.
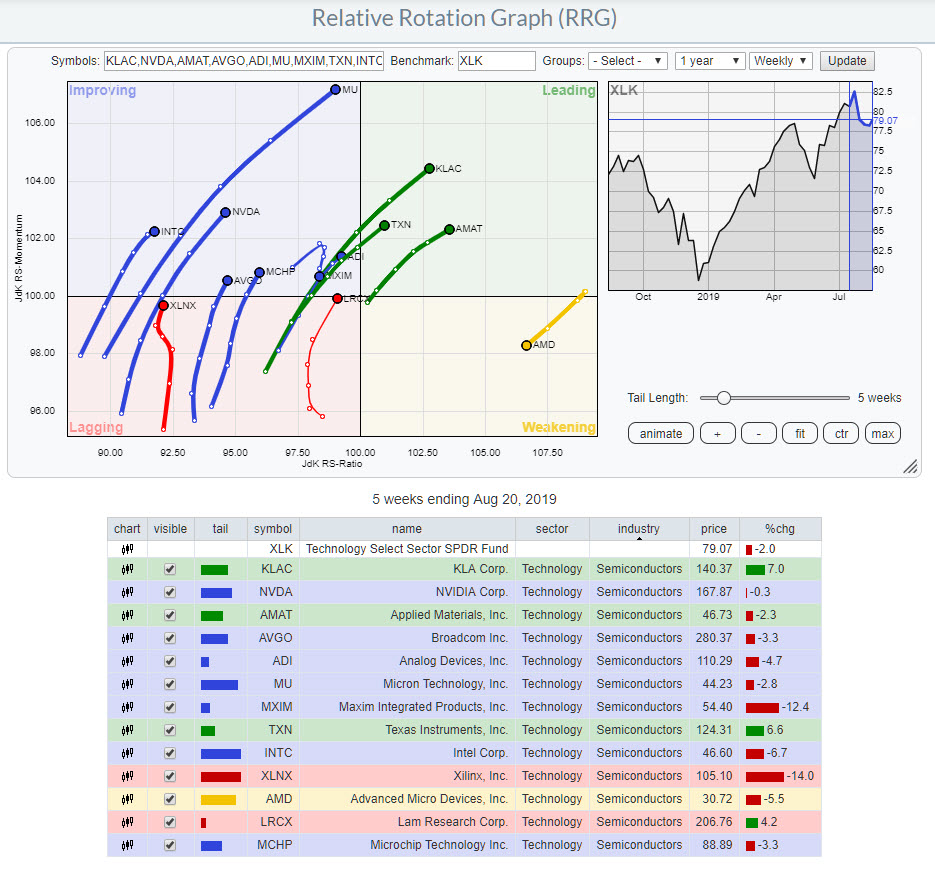
Another thing that you can do is sort that table on each column. When you click on the "Industry" column, the table will be sorted by industry. When you then toggle through the securities, you will see them grouped by industry and you can try to find a common direction.
The chart above shows the Semiconductors group as a subset of the Technology sector. You will only need one look to acknowledge that this group as a whole is rotating at a positive RRG-Heading. The exceptions are AMD, which is inside weakening but strongest on the RS-Ratio scale, and MXIM, which just hooked back towards lagging while inside improving.
All in all, the Technology sector (XLK) is starting to pick up relative strength again, while Semiconductors are leading the way!
Let me know what you think of this usage of RRG in the comments below. If you would like to receive a notification when a new RRG Charts blog article is published, simply subscribe with your email address using the form below.
Julius de Kempenaer Senior Technical Analyst, StockCharts.com Creator, Relative Rotation Graphs Founder, RRG Research
Want to stay up to date with the latest market insights from Julius?
– Follow @RRGResearch on Twitter – Like RRG Research on Facebook – Follow RRG Research on LinkedIn – Subscribe to the RRG Charts blog on StockCharts
Feedback, comments or questions are welcome at Juliusdk@stockcharts.com. I cannot promise to respond to each and every message, but I will certainly read them and, where reasonably possible, use the feedback and comments or answer questions.
To discuss RRG with me on S.C.A.N., tag me using the handle Julius_RRG.
RRG, Relative Rotation Graphs, JdK RS-Ratio, and JdK RS-Momentum are registered trademarks of RRG Research.
Julius de Kempenaer
Senior Technical Analyst, StockCharts.com
Creator, Relative Rotation Graphs
Founder, RRG Research
Host of: Sector Spotlight
Please find my handles for social media channels under the Bio below.
Feedback, comments or questions are welcome at Juliusdk@stockcharts.com. I cannot promise to respond to each and every message, but I will certainly read them and, where reasonably possible, use the feedback and comments or answer questions.
To discuss RRG with me on S.C.A.N., tag me using the handle Julius_RRG.
RRG, Relative Rotation Graphs, JdK RS-Ratio, and JdK RS-Momentum are registered trademarks of RRG Research.


