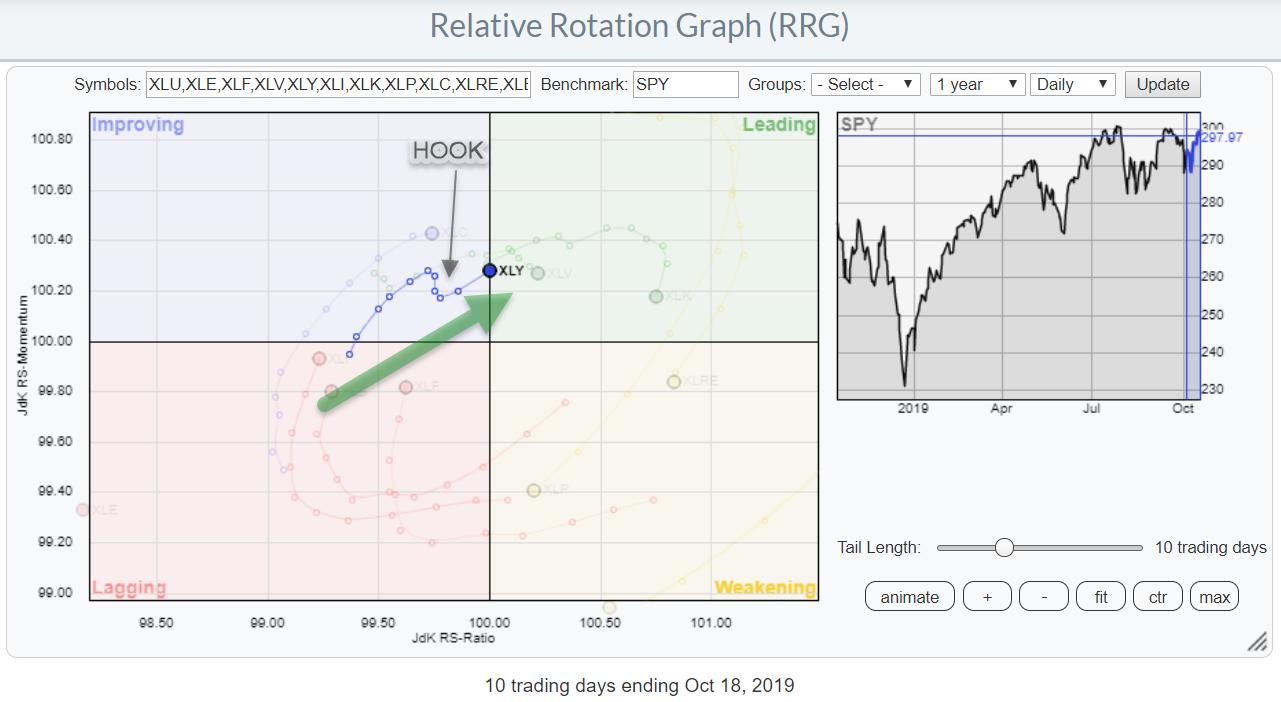
 The RRG chart above shows the relative position for US sectors based on last Friday's close.
The sector that stands out most at the moment, at least for me, is Consumer Discretionary. After initially rolling over inside the improving quadrant, this sector "hooked" back on track during the second half of the week.
These "hooks" are simply clockwise rotations that went so fast that they do not show up on this particular timeframe. This is a daily chart, the shortest that we can run here on StockCharts.com; we would need to go to hourly or 30-minute charts to see the rotational pattern showing up again.
The good news is that the rotation is going in a positive direction and the Consumer Discretionary sector is gaining on both axes. As of last Friday's close, the sector is on the verge of crossing over into the leading quadrant.
This rotational pattern makes it the sector to watch for this week.
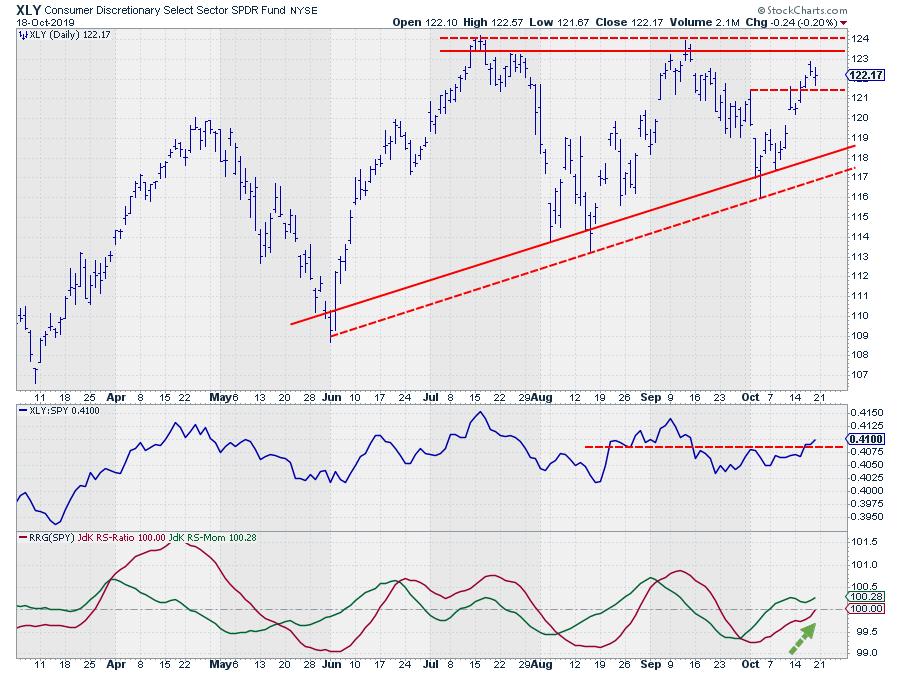
The price pattern developing since June can be seen as an ascending triangle. Three subsequent higher lows and two peaks around the same level indicate that sellers are present in the range between $123-124, while buyers are coming in at higher levels each time. This shows a rising support line, connecting these three lows.
The dashed lines are connecting the extremes while the solid lines are connecting the more solid lows. This goes for the overhead resistance as well. The RS-Line is breaking above its previous high after a small consolidation and now seems ready to push further.
All in all, things are looking good for Discretionary stocks this week and, unless major things happen today, we'll be having a look at this sector in tomorrow's Sector Spotlight show.
Questions and suggestions are welcome via email or social media channels, which you can find below this article.
-Julius
Want to stay up to date with the latest market insights from Julius?
– Follow @RRGResearch on Twitter – Like RRG Research on Facebook – Follow RRG Research on LinkedIn – Subscribe to the RRG Charts blog on StockCharts
Feedback, comments or questions are welcome at Juliusdk@stockcharts.com. I cannot promise to respond to each and every message, but I will certainly read them and, where reasonably possible, use the feedback and comments or answer questions.
To discuss RRG with me on S.C.A.N., tag me using the handle Julius_RRG.
RRG, Relative Rotation Graphs, JdK RS-Ratio, and JdK RS-Momentum are registered trademarks of RRG Research.
Julius de Kempenaer
Senior Technical Analyst, StockCharts.com
Creator, Relative Rotation Graphs
Founder, RRG Research
Host of: Sector Spotlight
Please find my handles for social media channels under the Bio below.
Feedback, comments or questions are welcome at Juliusdk@stockcharts.com. I cannot promise to respond to each and every message, but I will certainly read them and, where reasonably possible, use the feedback and comments or answer questions.
To discuss RRG with me on S.C.A.N., tag me using the handle Julius_RRG.
RRG, Relative Rotation Graphs, JdK RS-Ratio, and JdK RS-Momentum are registered trademarks of RRG Research.
