We, including myself, are always talking about offensive and defensive sectors, sector rotation from offensive to defensive, etc. Offensive sectors are the sectors that will do very well - and usually outperform - when the market goes up, while defensive sectors are the sectors that outperform when the market goes down. These sectors may still go down in value, but do so (much) less than the market, meaning they provide a good shelter during market declines.
Using the Sector Rotation Model
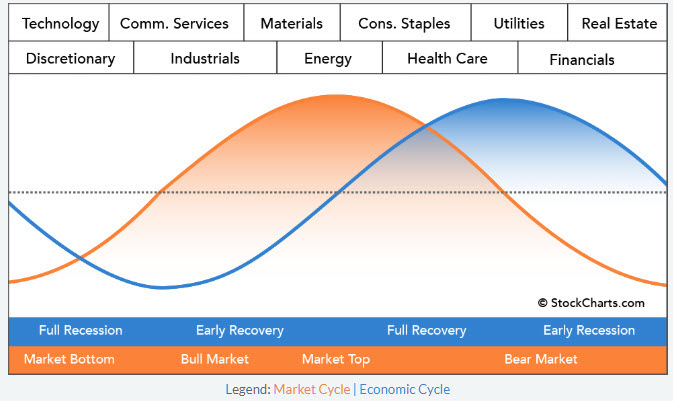
The qualifications for offensive and defensive sectors can be made in a variety of ways. One of the most popular is based on the economic cycle. The theoretical concept is illustrated in the image above and comes from the work of Sam Stovall in S&P's guide to sector rotation. The idea behind the image is that the stock market leads the economy by 6-9 months. The economic cycle is based on cycle (recession) data coming from the National Bureau of Economic Research. The sectors are then plotted on the market curve based on their historical performance during different phases of the cycle.
I have done some work, with Sam looking over my shoulder, to try to update the positioning of the sectors based on more recent data and include the new sectors Real Estate and Communication Services, but that does not appear to be a slam dunk. This is still work in progress but, as far as I can tell from the research so far, things have changed over the past twenty or so years. Who would expect that, huh...?
Trying BETA
In an attempt to look at things from another angle, I recently got the idea to try and classify offensive and defensive using BETA.
BETA is a widely used metric on Wall Street to measure the sensitivity of a stock against the benchmark (S&P 500). A BETA of 1 means that the stock moves in line with the benchmark. A BETA of 1.3 means that, when the market goes up 10%, the stock can be expected to rise 13%, but also that when the market drops 10%, the stock is expected to drop 13%. Low BETAs are obviously the reverse.
Thus, high BETA stocks (or sectors) are expected to do well when the market is on the rise, while low BETA stocks are expected to underperform when the market is going up but outperform when it is going down.
My idea was to use BETA as a ranking metric to classify sectors, or stocks, as offensive or defensive. Financial literature and the internet will provide you with plenty of examples and instructions on how to calculate BETA, but here is the very short version.
Calculating BETA
The BETA for a stock versus a benchmark (S&P 500) is done by calculating the co-variance of that stock and the S&P 500 and dividing that number by the variance of the S&P 500.
I have set up a spreadsheet that holds monthly data for all 11 sectors and calculates the BETA for every sector based on the look-back period, which is a variable which can be changed.
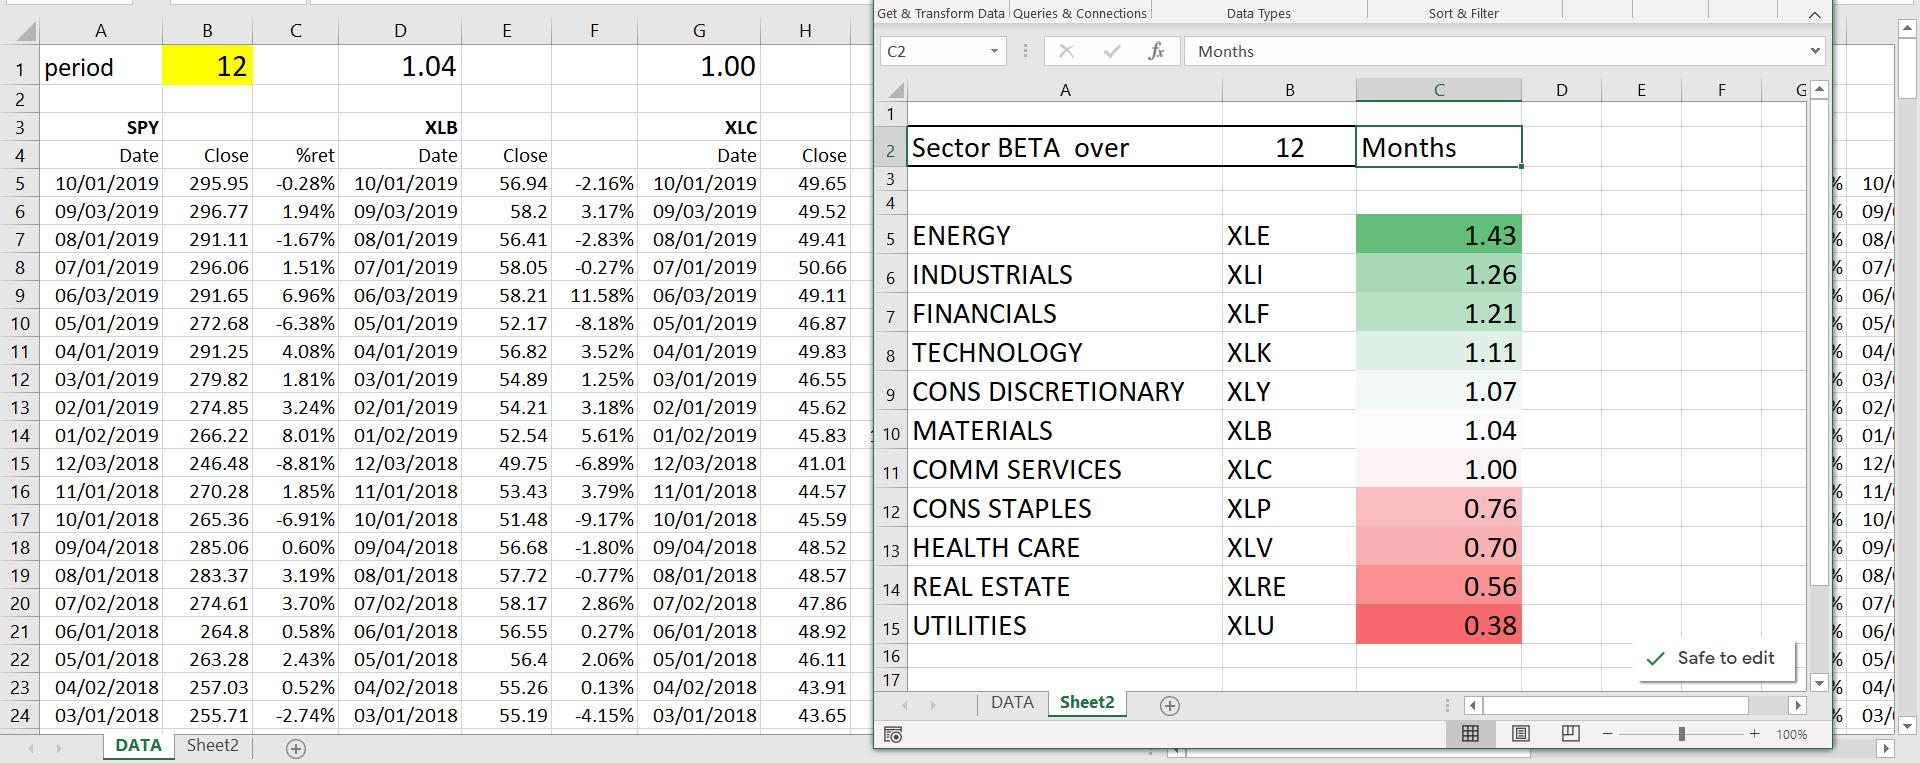
I talked about this approach in last Tuesday's Sector Spotlight show on StockCharts TV. If you missed the live show, you can watch the recording on the StockCharts YouTube channel here. If you would like to receive a copy of that spreadsheet for your own use, please drop me a message at Juliusdk@stockcharts.com and I'll be happy to share it with you.
The results, based on a 12-month BETA, are shown in the color-coded table, where we can see that Energy is the most sensitive sector at the moment and Utilities is the least sensitive.
Regarding Utilities, that is not much of a surprise as that is a well known defensive sector. In contrast, Energy, at least for me, was never really a very offensive sector. Two other surprises, at least for me, is the position of Consumer Discretionary and Materials. I had expected these sectors to be higher on the list, but they are only appearing somewhere in the middle.
Overlaying on a Relative Rotation Graph
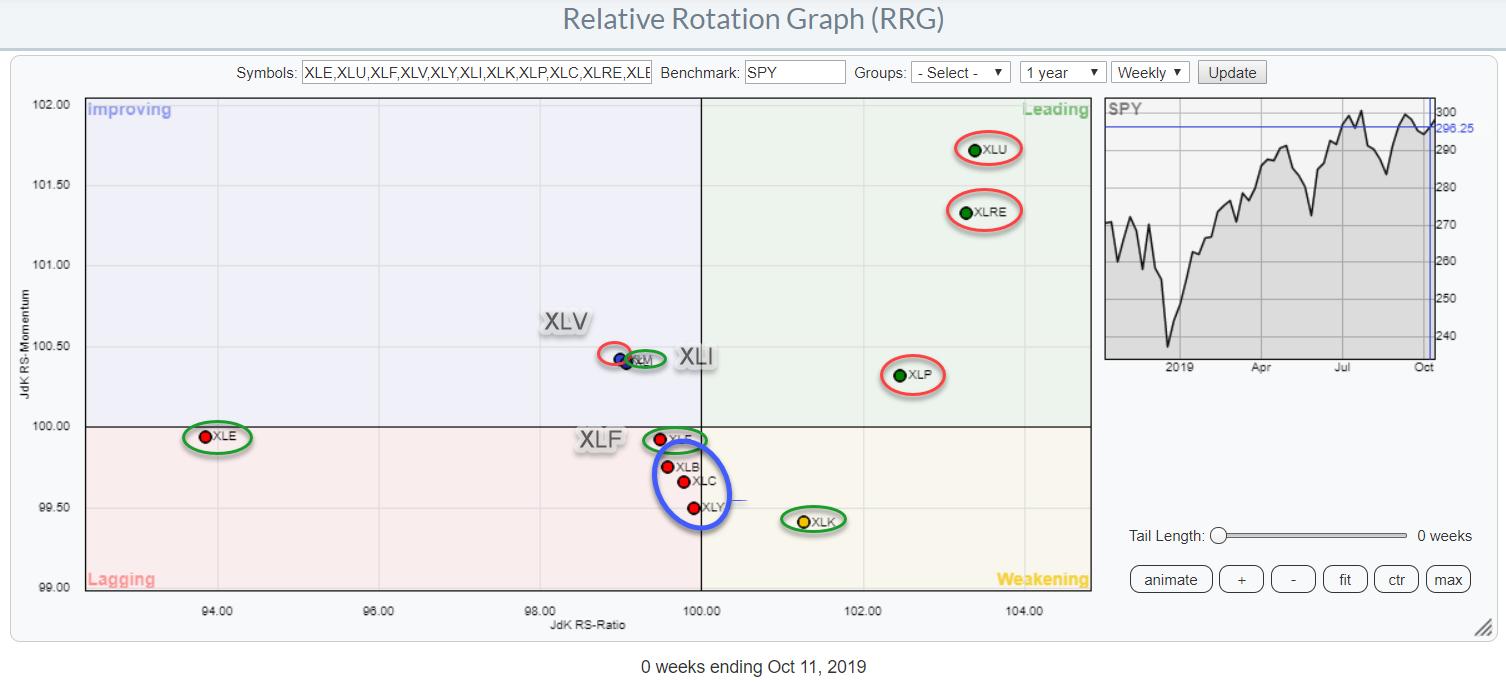
On the RRG above, I have overlaid the BETA ranking on the various sectors. With the exception of XLV, all defensives are inside the leading quadrant. The threesome in the middle - XLY, XLB, and XLC - are clustering together inside lagging, but are close to the 100-level on RS-ratio.
The offensive sectors are spread out. Energy is on the far-left and the weakest sector at the moment, while Industrials, Financials and Technology are middle of the range for now. Based on this image, defensive sectors continue to dominate at the right-hand (positive) side of the RRG, urging caution for the market as a whole.
Think of it as an orange blinking traffic light; you can still continue, but be careful!
-Julius
Want to stay up to date with the latest market insights from Julius?
– Follow @RRGResearch on Twitter – Like RRG Research on Facebook – Follow RRG Research on LinkedIn – Subscribe to the RRG Charts blog on StockCharts
Feedback, comments or questions are welcome at Juliusdk@stockcharts.com. I cannot promise to respond to each and every message, but I will certainly read them and, where reasonably possible, use the feedback and comments or answer questions.
To discuss RRG with me on S.C.A.N., tag me using the handle Julius_RRG.
RRG, Relative Rotation Graphs, JdK RS-Ratio, and JdK RS-Momentum are registered trademarks of RRG Research.
Julius de Kempenaer
Senior Technical Analyst, StockCharts.com
Creator, Relative Rotation Graphs
Founder, RRG Research
Host of: Sector Spotlight
Please find my handles for social media channels under the Bio below.
Feedback, comments or questions are welcome at Juliusdk@stockcharts.com. I cannot promise to respond to each and every message, but I will certainly read them and, where reasonably possible, use the feedback and comments or answer questions.
To discuss RRG with me on S.C.A.N., tag me using the handle Julius_RRG.
RRG, Relative Rotation Graphs, JdK RS-Ratio, and JdK RS-Momentum are registered trademarks of RRG Research.


