 Daily RRG for US sectors highlighting XLF
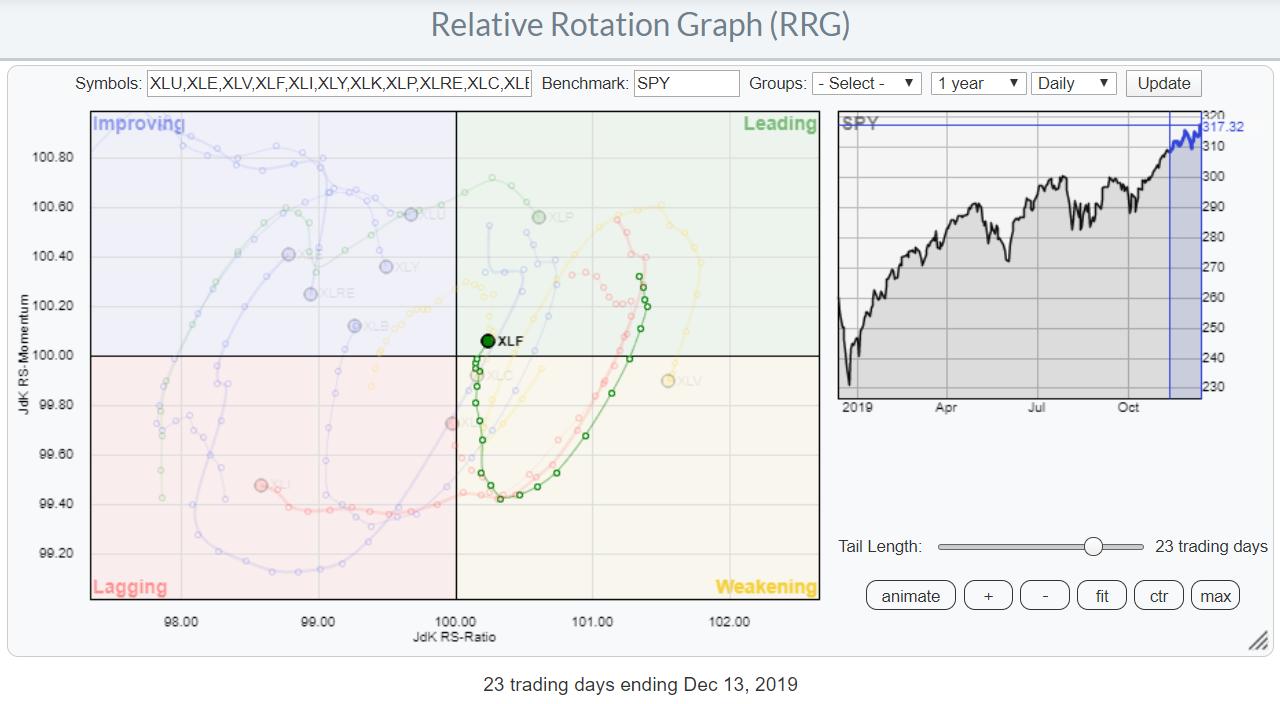
Above is the daily Relative Rotation Graph for US sectors, highlighting the rotation for the financials sector. On the weekly RRG, this sector is solidly inside the leading quadrant and continues to move further west into positive territory.
With the current rotation on the daily RRG moving from weakening back up into leading, XLF has becomes a sector to watch closely, with a new (up-)leg of the already existing relative uptrend seems to be getting underway.
This type of synchronized rotation is enough reason to take a better look at the rotations of individual stocks in this sector against XLF.
 Weekly RRG of XLF members vs XLF
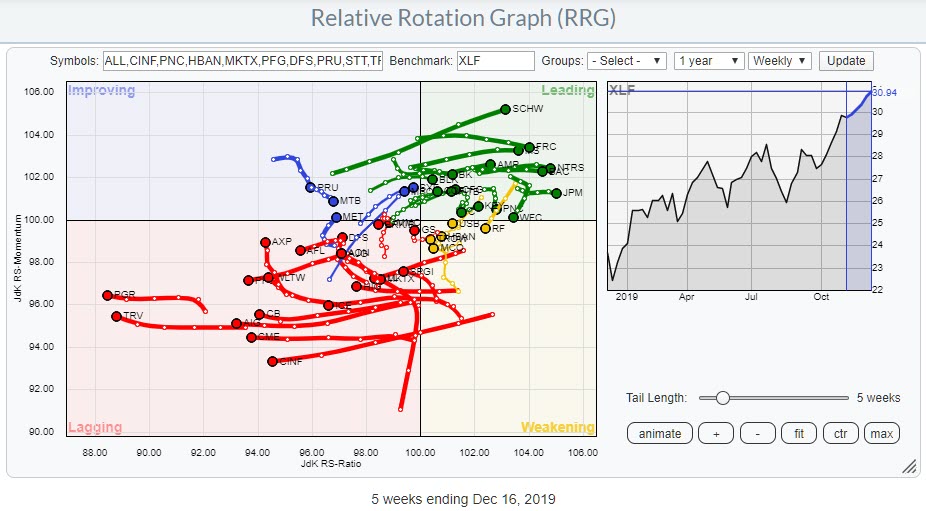
The RRG above shows the rotation of the stocks inside the financials sector against XLF. I have switched off the tail for STT as it is far inside the leading quadrant and distorting the already busy graph.
What is interesting to see is that there are a significant number of "almost horizontal" tails in both the leading and lagging quadrants. These horizontal tails are indicating stable trends, without any momentum-driven accelerations or decelerations.
The RRG below shows a selection of stocks with interesting tails, positive and negative alike.
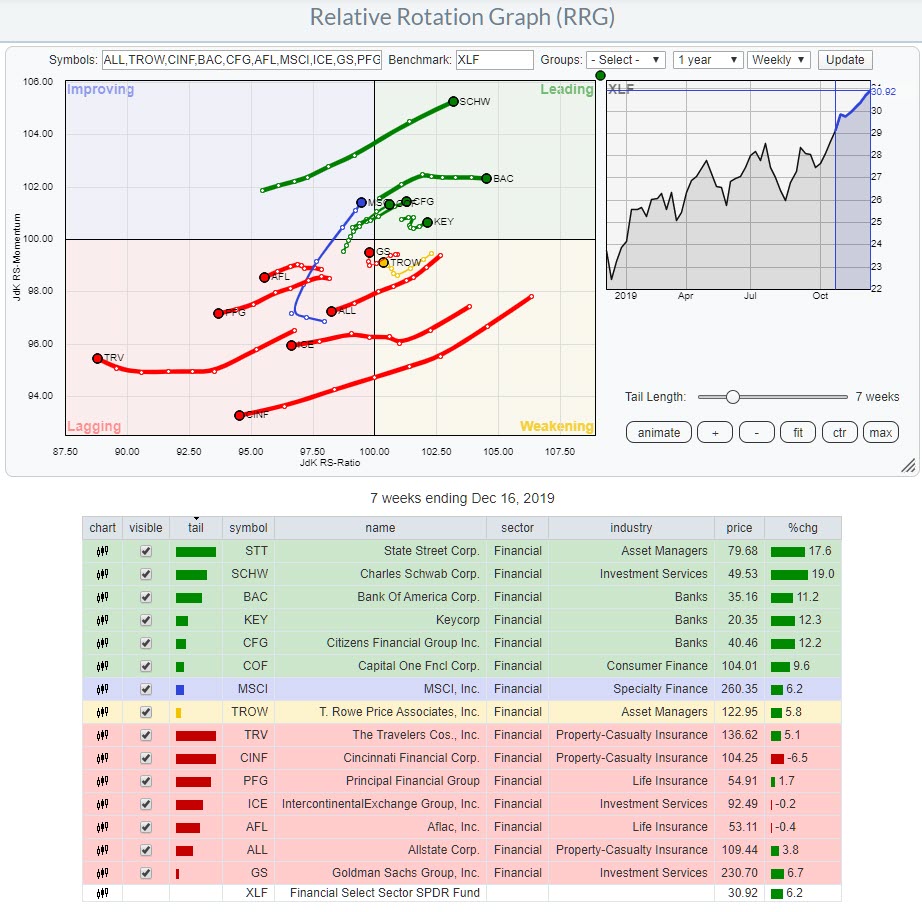 Weekly RRG for selected stocks in Financials sector
Leading
State Street Corp - STT
Of those inside the leading quadrant, STT is the furthest away (it's the green dot in the top-right corner) but started to decline on the JdK RS-Momentum axis some weeks ago. It is definitely one of the stronger stocks in this universe. From an investment/trading perspective, it might be wiser to wait for some pullback, as the rally out of the September low has not shown a meaningful correction yet.
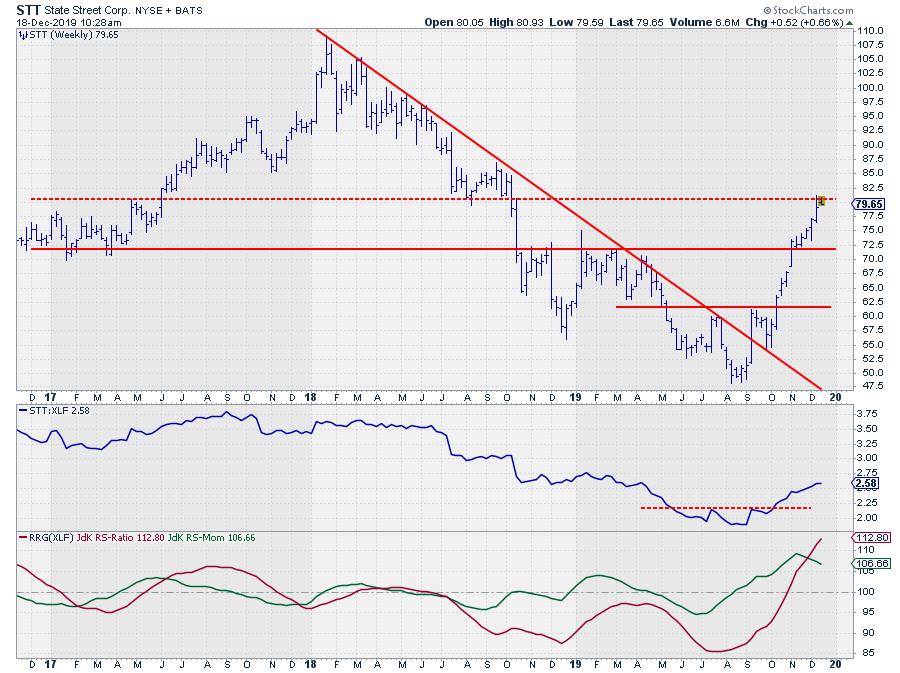
At the moment, STT is pushing against a horizontal resistance level, which could lead to such a correction back down towards the $ 72.50 area where former resistance is now likely to start acting as support.
The relative outlook for STT is definitely positive, after turning around the RS-Line that was declining for almost two years. Given the strong JdK RS-Ratio, a rotation from leading to weakening and then back into leading is a realistic scenario.
Charles Schwab - SCHW
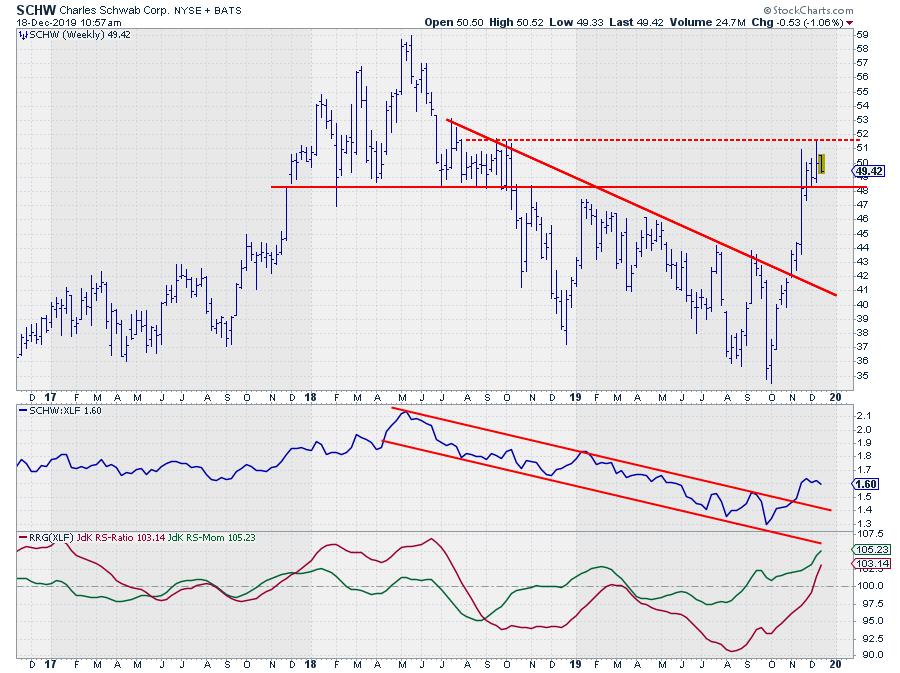
SCHW broke falling trend lines on both the price and relative charts. The rally over the past 6-8 weeks was very strong and steep, so, just like STT, a corrective move could be around the corner as the stock is testing price resistance.
Such a correction will very likely offer (new) buying opportunities. Support levels are expected to come into play at either around $48 or $44 (or both).
Citizens Financial Group Inc - CFG
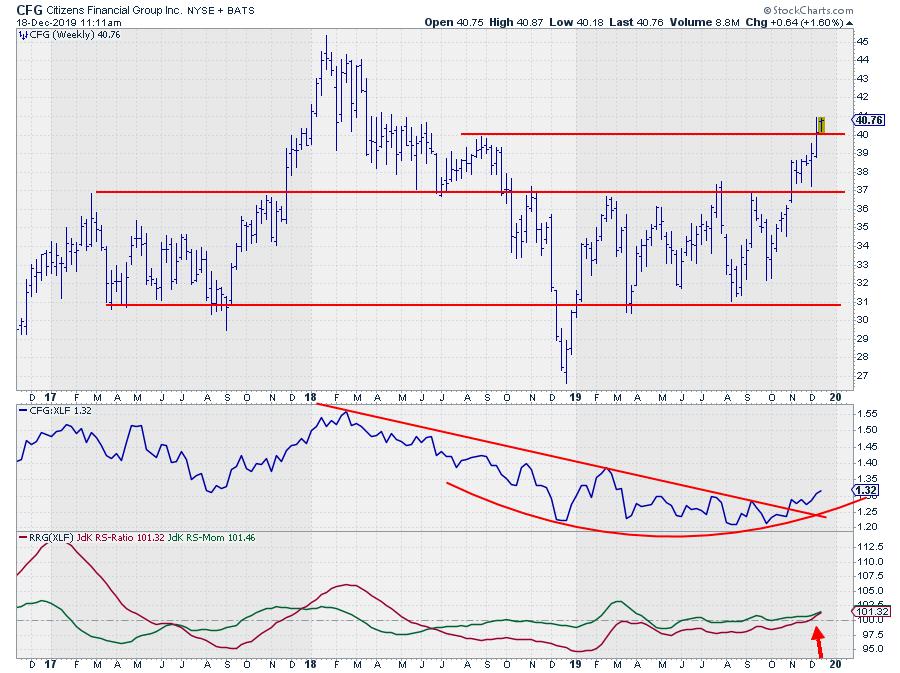
The rotation for CGF on the RRG shows a tail that has just crossed into the leading quadrant, which means that there is plenty of room to move further ahead.
On the chart above, the RS-Line is sending strong signals after the recent completion of a long stretched bottoming formation. The break of the falling resistance line on relative strength signaled the end of the consolidation following an almost two-year declining trend and the start of a new series of higher highs and higher lows.
Around the same time, the RS-Ratio line joined RS-Momentum above 100 after a long time below. CFG is now rising on both axes of the RRG, resulting in a strong RRG-Heading.
Combine that with the recent break above resistance ($40) on the price chart and all ingredients are there for a further rally and outperformance vs. XLF.
Capital One Financial Group - CFG
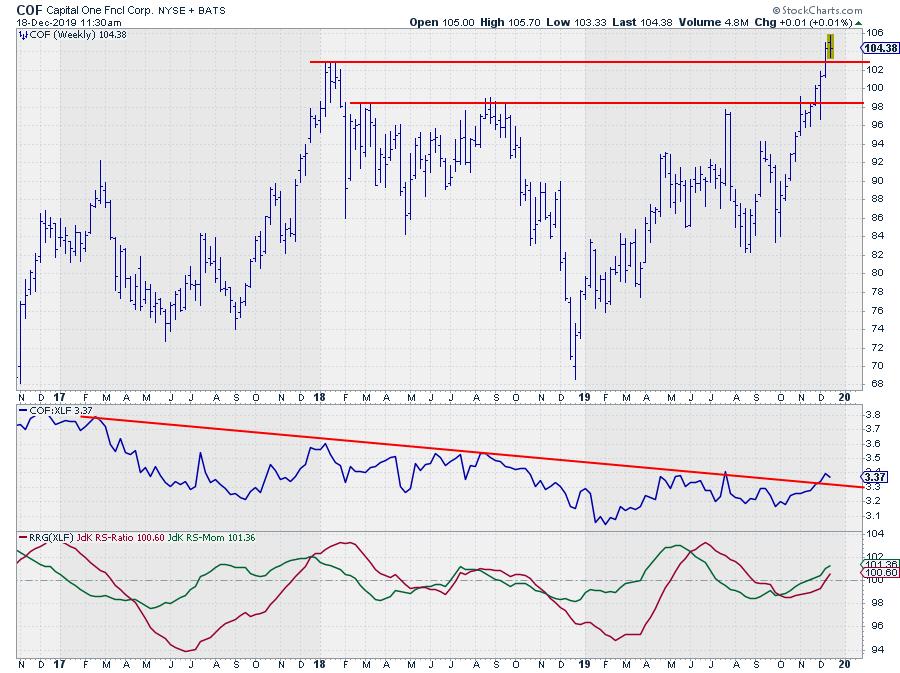
A similar chart and rotational pattern is presented by COF. The three-year relative downtrend seems to be coming to an end with both RRG-Lines solidly above 100 and rising, which sends COF deeper into the leading quadrant.
On the adjusted price chart printed above, COF is taking out resistance coming off the early 2018 high. On the unadjusted chart, the peak at $106 may offer some resistance on the way up; breaking that level will add extra fuel to the positive trends on both price and relative charts.
Lagging
Allstate Corp. - ALL
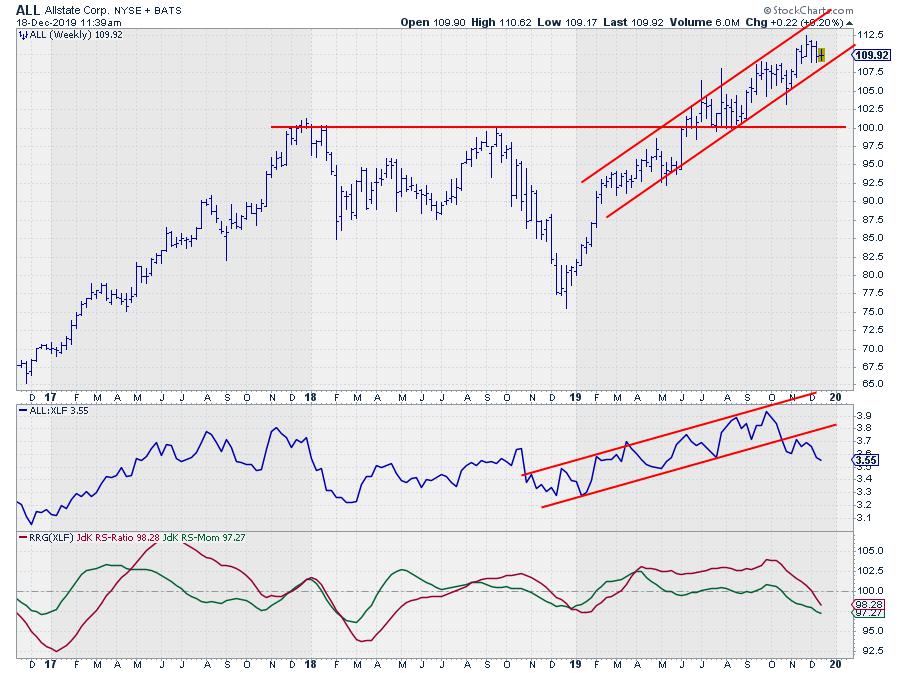
Allstate entered the lagging quadrant a few weeks ago and is now moving further into it while losing on both scales. This is causing a weak RRG-heading that suggests further underperformance vs. XLF.
The uptrend in the RS-Line was recently broken downward. A new series of lower highs and lower lows has started, while both RRG-Lines are now below 100 and falling.
On the price chart, ALL is still inside the boundaries of its rising channel. This is typical for stocks in a strong sector relative to the benchmark (S&P 500). Very often, there is nothing wrong with the price chart as such; it's the relative performance that is lagging its sector index, in this case XLF, and causing it to show up inside the lagging quadrant on this Relative Rotation Graph.
The message is simple: there are other stocks in this sector that are rising even faster.
Intercontinental Exchange Group Inc. - ICE
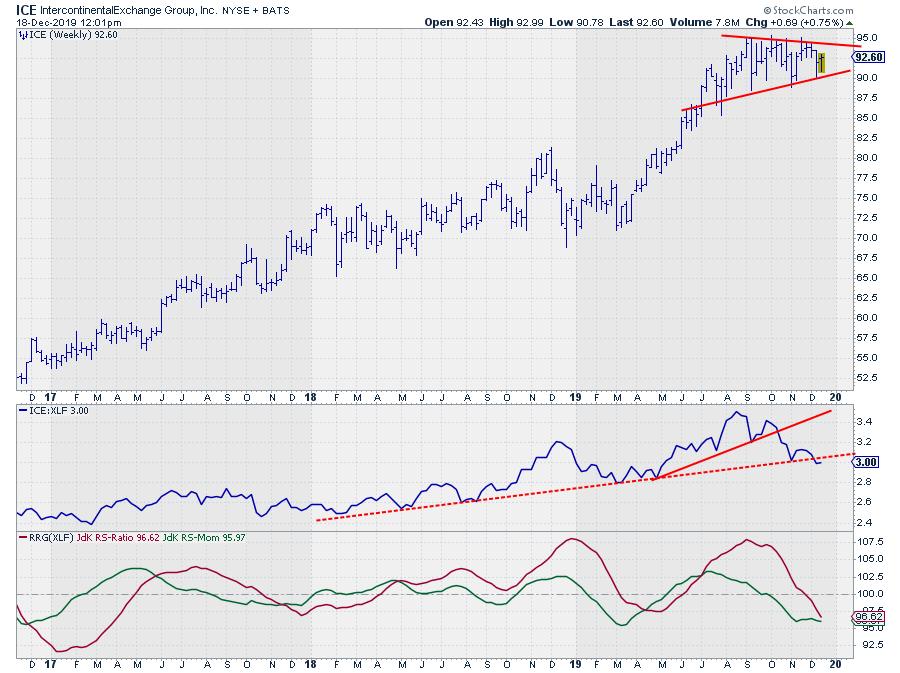
ICE is in a consolidation pattern following a nice run from March to September this year. The consolidation is taking place in a triangle-like formation, which means that only a breakout will give us a clue about the subsequent direction with regard to price.
The RS-Line, on the other hand, is sending a pretty clear signal saying "Stay away." A short-term support line was broken a few months ago and a longer-term support line is about to break at the moment. With the RRG-Lines well below 100 and still declining, that further puts the tail of ICE (deeper) into the lagging quadrant, signalling a further underperformance vs. XLF.
All in all, the Financials sector is looking good and there are plenty of good charts to be found, especially in the Banks and Asset Managers groups.
--Julius
Julius de Kempenaer
Senior Technical Analyst, StockCharts.com
Creator, Relative Rotation Graphs
Founder, RRG Research
Want to stay up to date with the latest market insights from Julius?
– Follow @RRGResearch on Twitter
– Like RRG Research on Facebook
– Follow RRG Research on LinkedIn
– Subscribe to the RRG Charts blog on StockCharts
Feedback, comments or questions are welcome at Juliusdk@stockcharts.com. I cannot promise to respond to each and every message, but I will certainly read them and, where reasonably possible, use the feedback and comments or answer questions.
To discuss RRG with me on S.C.A.N., tag me using the handle Julius_RRG.
RRG, Relative Rotation Graphs, JdK RS-Ratio, and JdK RS-Momentum are registered trademarks of RRG Research.
Julius de Kempenaer
Senior Technical Analyst, StockCharts.com
Creator, Relative Rotation Graphs
Founder, RRG Research
Host of: Sector Spotlight
Please find my handles for social media channels under the Bio below.
Feedback, comments or questions are welcome at Juliusdk@stockcharts.com. I cannot promise to respond to each and every message, but I will certainly read them and, where reasonably possible, use the feedback and comments or answer questions.
To discuss RRG with me on S.C.A.N., tag me using the handle Julius_RRG.
RRG, Relative Rotation Graphs, JdK RS-Ratio, and JdK RS-Momentum are registered trademarks of RRG Research.


