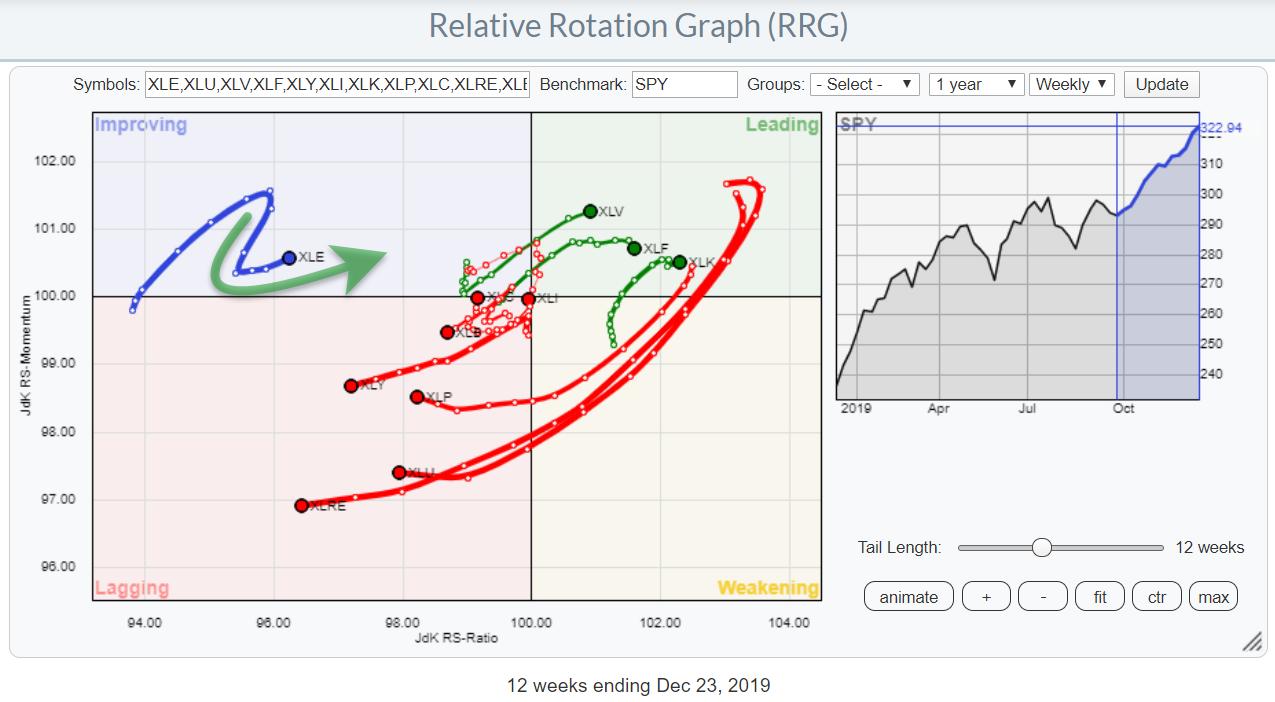
 Weekly RRG for US sectors
The RRG showing the Relative Rotation for US sectors has the energy sector inside the improving quadrant. Make no mistake, based on the JdK RS-Ratio reading, this is still the weakest sector in the S&P 500 - but things seem to be changing.
XLE crossed from weakening into the lagging quadrant in September 2018 and has been on the left side of the RRG since then, with one rotation from lagging into improving and then back to lagging from late January 2019 to late May 2019.
In October, XLE crossed from lagging into improving again, but started to roll over and head back down again after only a few weeks into the rotation. The sector seemed poised for a return to the lagging quadrant and completed another rotation at the left side of the RRG, which is typical for (very) weak relative trends.
The "hook"
In the last two weeks, however, the path for XLE changed rapidly and the sector "hooked" back and started traveling on a strong RRG-Heading (0-90 degrees), moving back up into the improving quadrant.
As I said at the begin of this article, make no mistake - this is still a weak sector from a relative point of view, but we need to be aware of an underlying shift in strength building up.
This "hook" on the weekly RRG is another good example that can be used to show that the rotational pattern is always there, even when the hook suggests it is not. In such cases, we need to shift to a lower timeframe, in this case daily, to see the rotational behavior again.
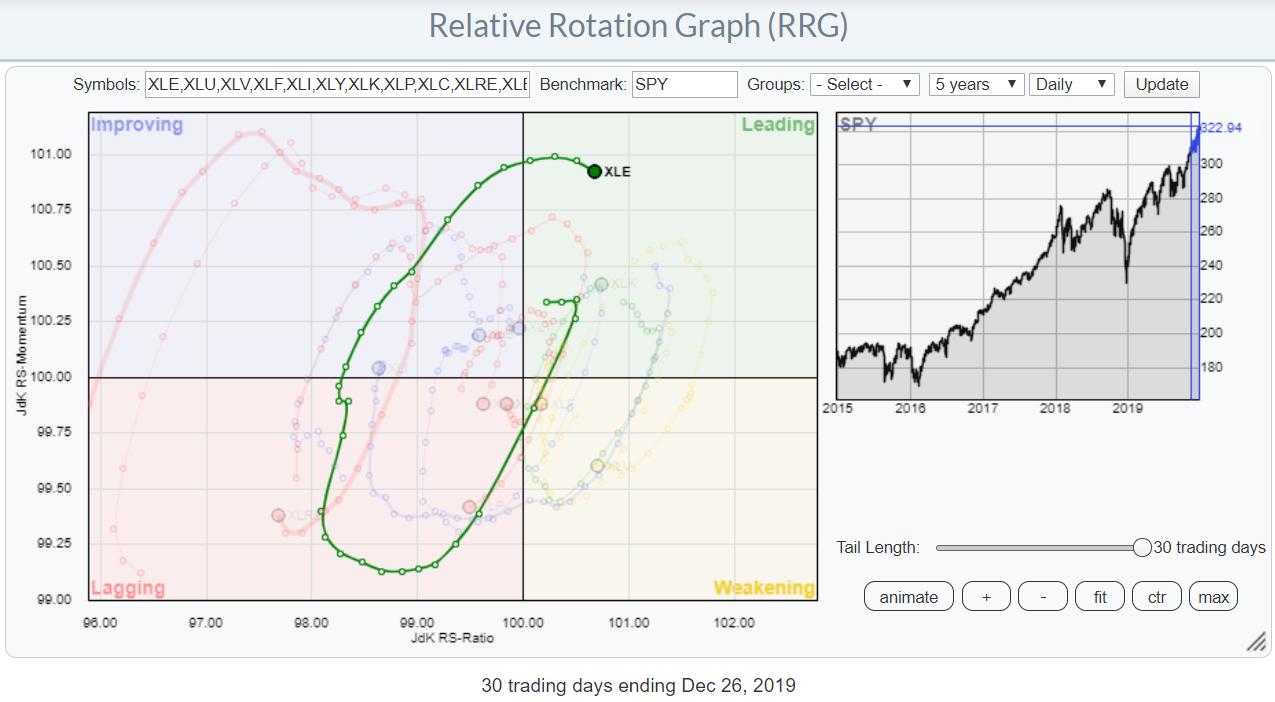 Daily RRG for US sectors highlighting the rotational path for XLE despite "hook" on weekly
The daily RRG above shows the rotational path that the Energy sector traveled while it "hooked" on the weekly RRG. The rotation was just too fast to be picked up on the weekly time frame.
Price and Relative Chart
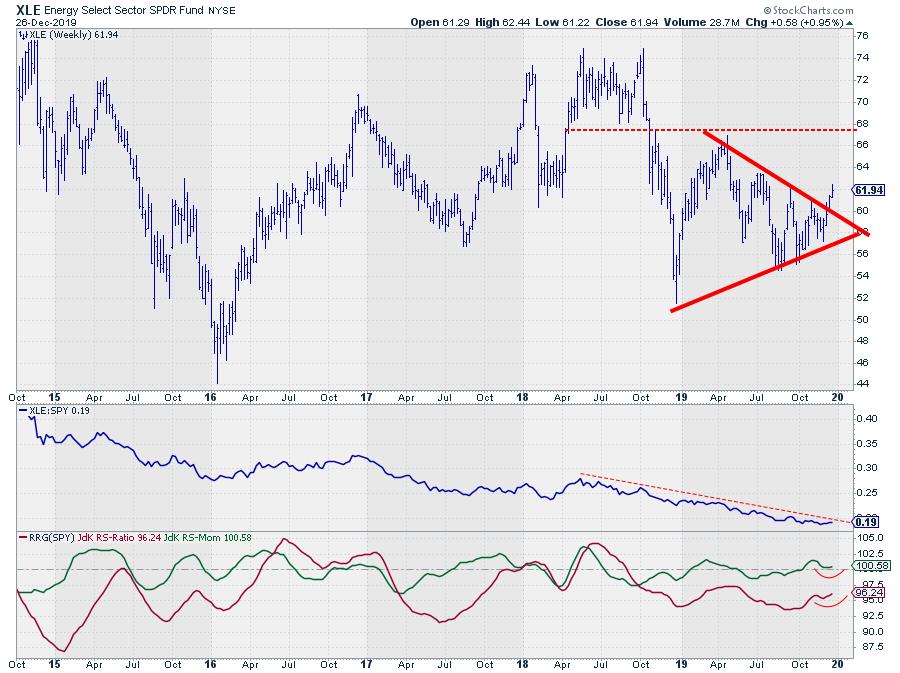
When we switch to the regular price chart (weekly) for XLE, in combination with relative strength and the RRG-Lines versus SPY, we see a breakout from the triangle-like consolidation pattern that had developed since the start of 2019. It is still an early-stage improvement, but new trends need to start somewhere.
The RS-Line is still showing a downtrend capped by the falling resistance line, but the RRG-Lines are detecting underlying improvement of relative strength, as both the JdK RS-Ratio and the JdK RS-Momentum lines started to curl upward recently.
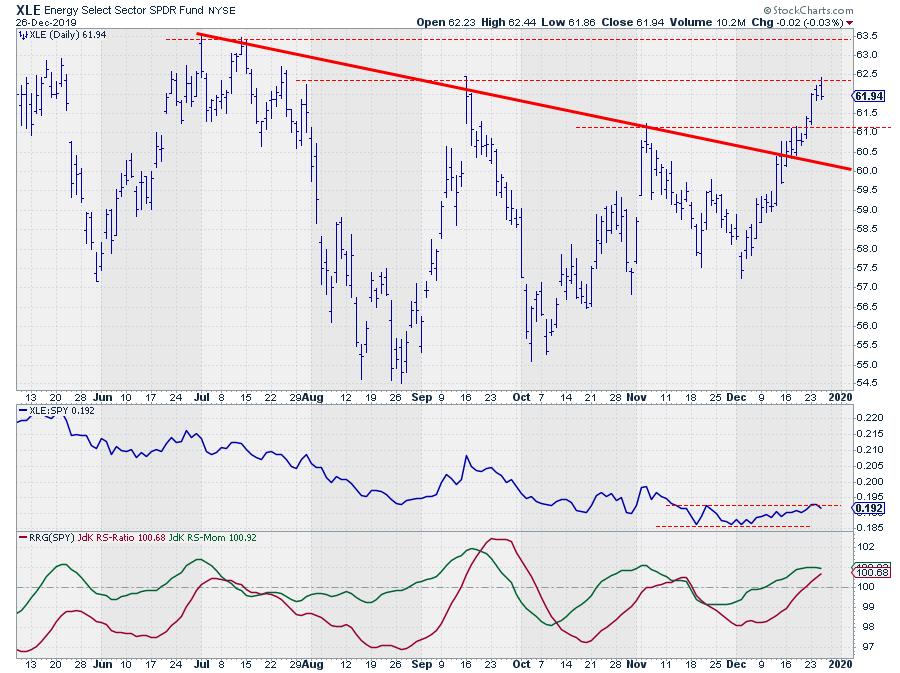
The daily version of that chart shows the improvement in a bit more detail. The falling resistance line is clearly broken and XLE is now facing a few intermediate resistance levels coming off previous highs. Ideally, XLE's price should now start to form a new series of higher highs and higher lows to build further on this potential base.
The same goes for the relative strength line, which just started to work its way higher after two lows around the same level in November/December.
As mentioned, it is still in the early stages, but improvements are becoming visible for this sector. It is now time to monitor this sector a bit more closely to see if these improvements can hold up and get firmer in the coming weeks.
--Julius
Later today (12/27) at 11am EST, I will be joining Tow Bowley at earningsbeats.com for a Market Vision 2020 mini-series event in the run-up to the actual #MV2020 event that will be held on Saturday 1/4/2020. Today, I will do an introduction to the RRG visualization and show a few ways how investors can implement RRGs in their daily/weekly/monthly workflow.
The mini-series event is free, but requires registration for the free #MV2020 newsletter. However, if you agree to allow earningsbeats.com to add your name and email address to this newsletter (again, no charge whatsoever), then use this link to come join us directly. The event starts at 11:00am EST and the room will be open by 10:30am EST at the latest.
Hope to see you there.
Julius de Kempenaer
Senior Technical Analyst, StockCharts.com
Creator, Relative Rotation Graphs
Founder, RRG Research
Want to stay up to date with the latest market insights from Julius?
– Follow @RRGResearch on Twitter
– Like RRG Research on Facebook
– Follow RRG Research on LinkedIn
– Subscribe to the RRG Charts blog on StockCharts
Feedback, comments or questions are welcome at Juliusdk@stockcharts.com. I cannot promise to respond to each and every message, but I will certainly read them and, where reasonably possible, use the feedback and comments or answer questions.
To discuss RRG with me on S.C.A.N., tag me using the handle Julius_RRG.
RRG, Relative Rotation Graphs, JdK RS-Ratio, and JdK RS-Momentum are registered trademarks of RRG Research.
Julius de Kempenaer
Senior Technical Analyst, StockCharts.com
Creator, Relative Rotation Graphs
Founder, RRG Research
Host of: Sector Spotlight
Please find my handles for social media channels under the Bio below.
Feedback, comments or questions are welcome at Juliusdk@stockcharts.com. I cannot promise to respond to each and every message, but I will certainly read them and, where reasonably possible, use the feedback and comments or answer questions.
To discuss RRG with me on S.C.A.N., tag me using the handle Julius_RRG.
RRG, Relative Rotation Graphs, JdK RS-Ratio, and JdK RS-Momentum are registered trademarks of RRG Research.


