
In my last article for the Don't Ignore This Chart blog, which I write for on Thursdays, I wrote about the clear message that the rotation of Growth vs. Value is currently sending. As those are short articles meant to point to potentially interesting situations and usage of particular charts, I decided to get back to get back to this subject a little bit more in depth in this RRG blog article.
The Idea
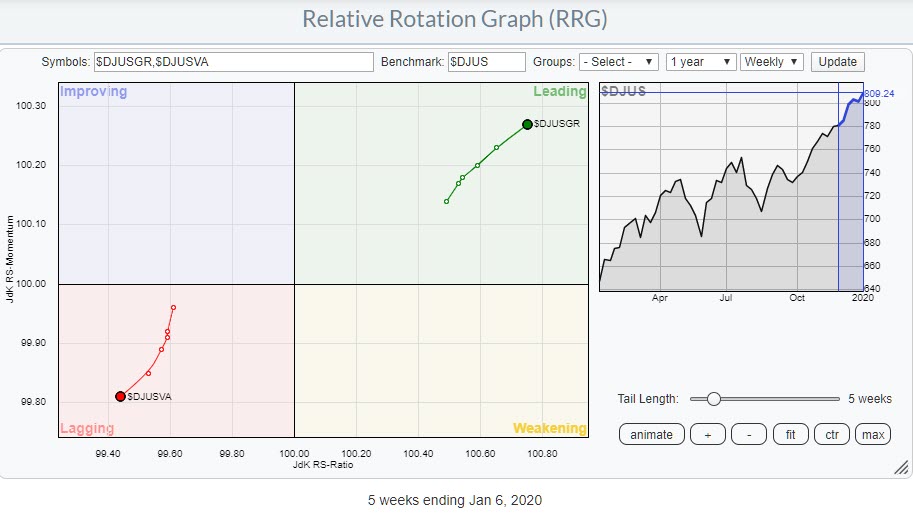 Weekly RRG showing Growth vs. Value rotation
The idea for the DITC article mentioned above started with this RRG, which you can load from the predefined groups on the RRG-page. Since this rotation shows a clear preference for Growth stocks over Value, I decided that it was interesting enough to showcase and write about.
The Problem
The problem with that "idea," as it was, is that it is not immediately actionable. The chart shows the rotation for:
- $DJUSGR - Dow Jones US Growth Index
- $DJUSVA - Dow Jones US Value Index
- $DJUS - Dow Jones US Index << the Benchmark (center of the chart)
At the end of the day, though, we cannot buy an "index" - we need some "instrument" to actually create exposure to that index. And those instruments come in many forms.
ETFs are a very popular way to create exposure to an index. Pretty much all major indexes have one or more ETFs tracking their performance. Futures contracts also offer the possibility to create exposure to a specific index or options on an index. If you are outside the US, CFDs (Contract for Difference) are often available on indexes. And don't forget the good old mutual funds - though they are usually not "tracking" funds, the various mandates can be used to pick a fund to create exposure to a specific segment of the market.
In this case, I wanted to see what ETFs are available for creating exposure to Growth and Value stocks, based on some easily available index.
The Search
In order to find those ETFs, I used the search function on StockCharts.com. You can start your search from the entry field for SharpCharts at the top of the screen, but, when I am really looking for something specific, I prefer to use the Symbol Catalog.
When you simply type in "growth" in the search box on that page, you will get a lot (and I mean a lot) of hits. There are many funds, ETFs and indexes that have "growth" in their name. Luckily, you can do more specific searches.
In this case, I am looking for ETFs that track growth stocks, so I add "ETF" to my search, which now looks like this:
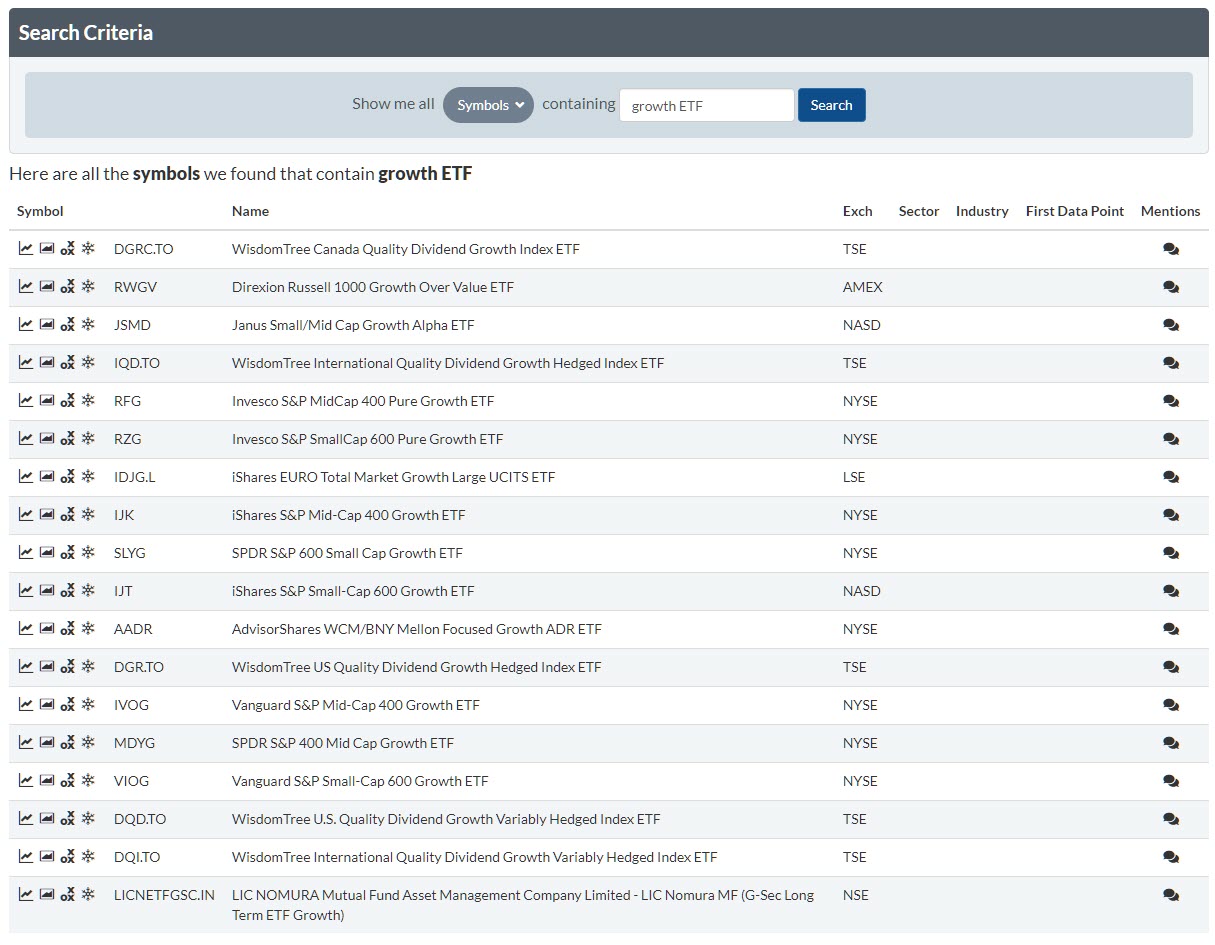
The total number of pages has now shrunk to three, which is more manageable. But still there are quite a bit. When I am analyzing sets of data, especially when it comes to ETFs, I prefer to use ETFs from the same "family," i.e. the same provider.
On this list, that means there's only one step more to drill down to the ETFs that are tracking growth stocks (in the US) - I simply have to add the name of the provider as a search criteria. For Blackrock's iShares family that leads to this list below. (If you click on the image, it will take you directly to these search results.)
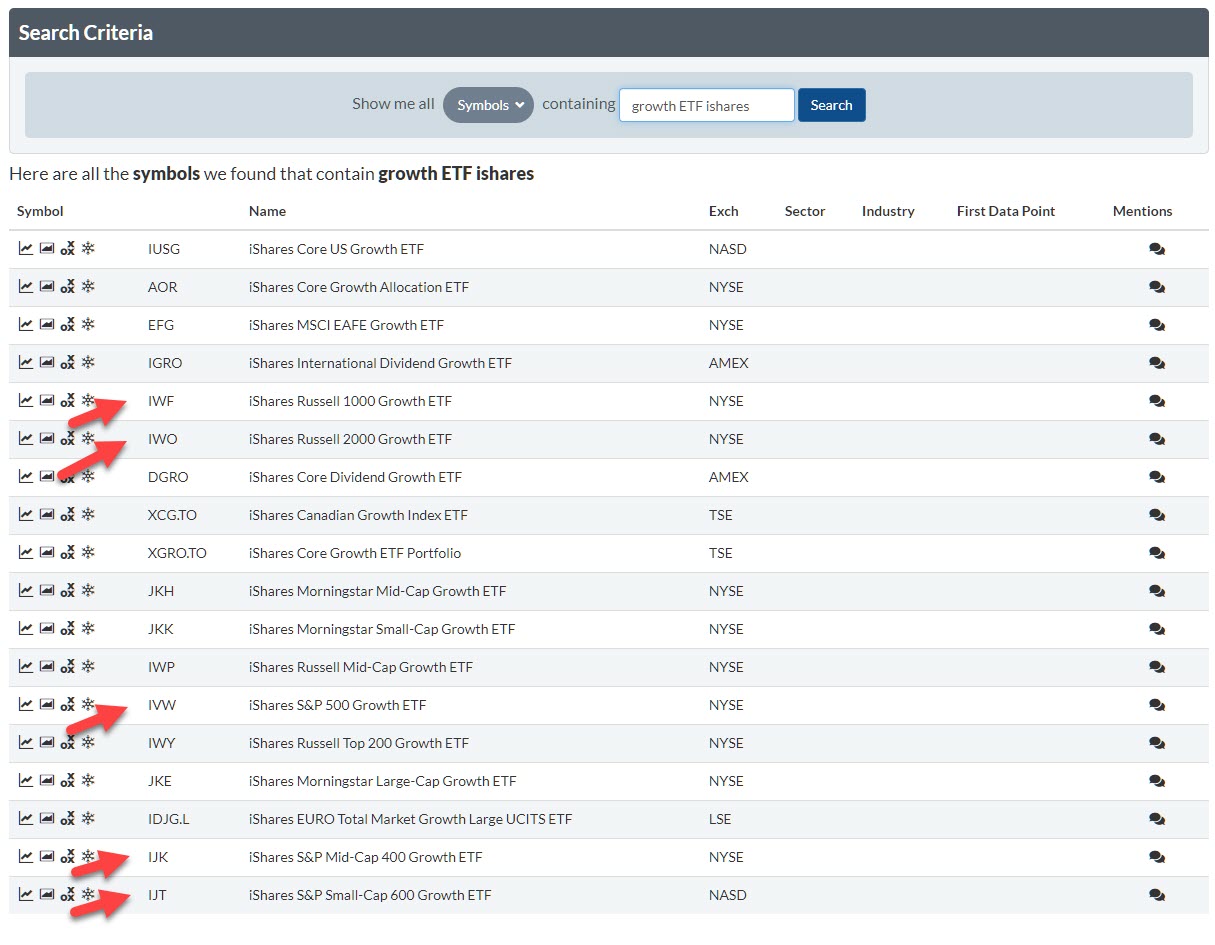
From that list we can then see on what underlying indexes these ETFs are available. I have pointed some arrows to the more popular indexes, like the Russell 1000 and 2000, and the three size segments in the S&P (1500) index, i.e. small-, mid- and large-cap.
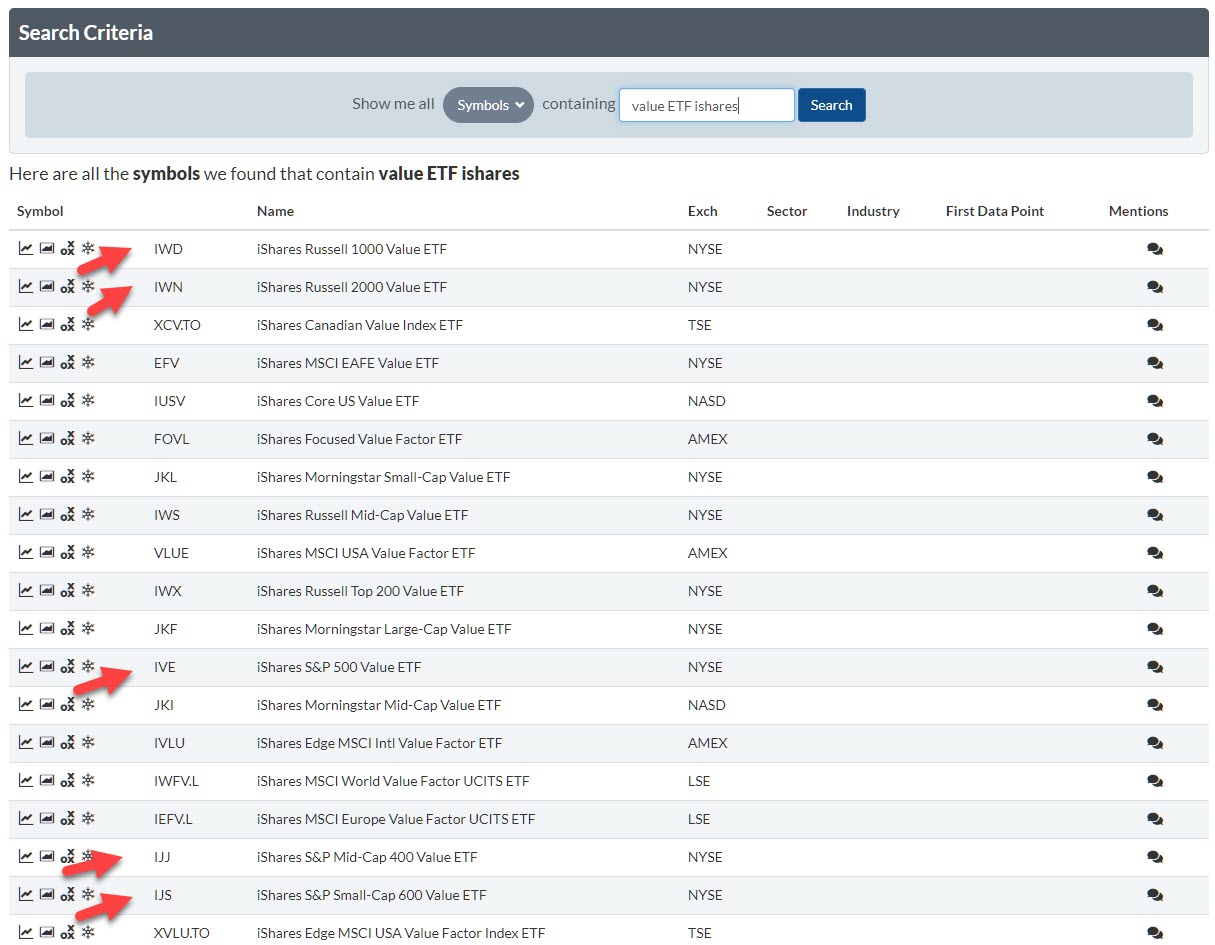
To find the value counterparts for these ETFs, we just have to change growth to value in the search box which will give us this list.
If you prefer State Street's SPDR series, these are your options:
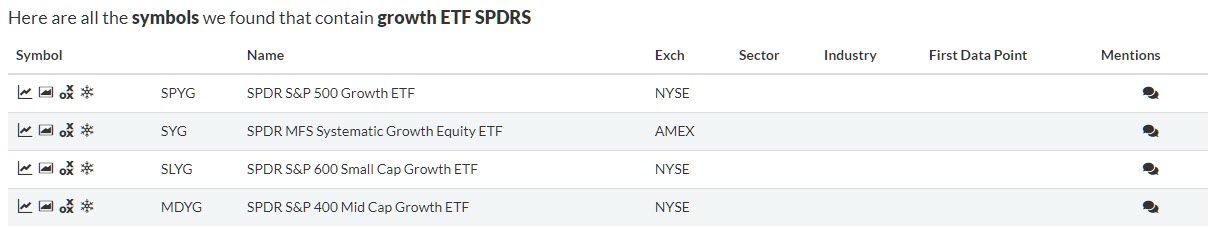
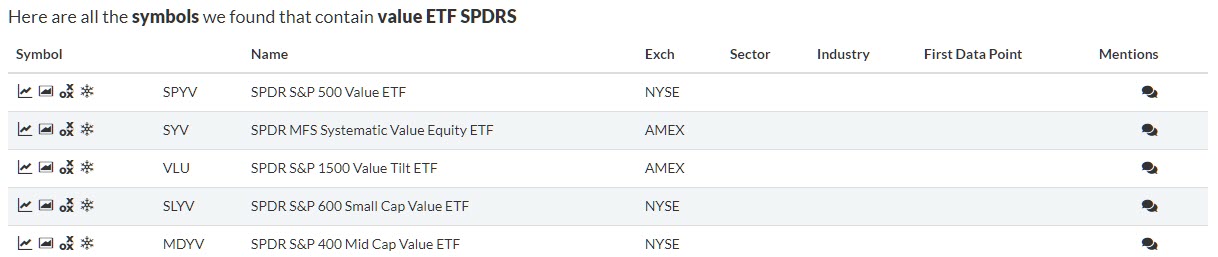
These results are all "investable" instruments that you can actually use in your portfolio to create exposure to these market segments.
Compare, compare, compare!
Before actually pulling the trigger, I always like to double-check and find out if the selected instruments are actually doing what I expect them to be doing. In this case, that means tracking the performance of growth and value stocks as defined by the DJ indexes that are used in the RRG at the top of the article.
In order to do that, I add the ticker symbols for the ETFs that I am watching to the RRG and see if their rotation matches (more or less, it does not have to be exact) the rotation of the indexes that I based my idea on.
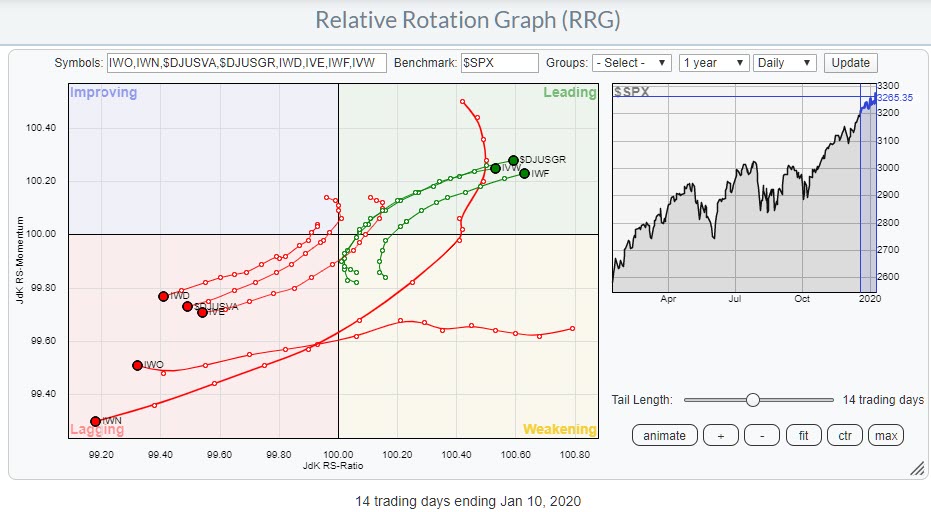
The RRG above shows a selection of ETFs that track Growth and Value ETFs. When you toggle through the individual tails (CTRL+arrow up/dn), you will see that the rotations for the growth ETFs are grosso modo the same (as the index) and also for value.
With one exception, that is...... the Russell 2000 ETFs. Both are inside the lagging quadrant. How is that possible?
It's the Benchmark, Stupid!
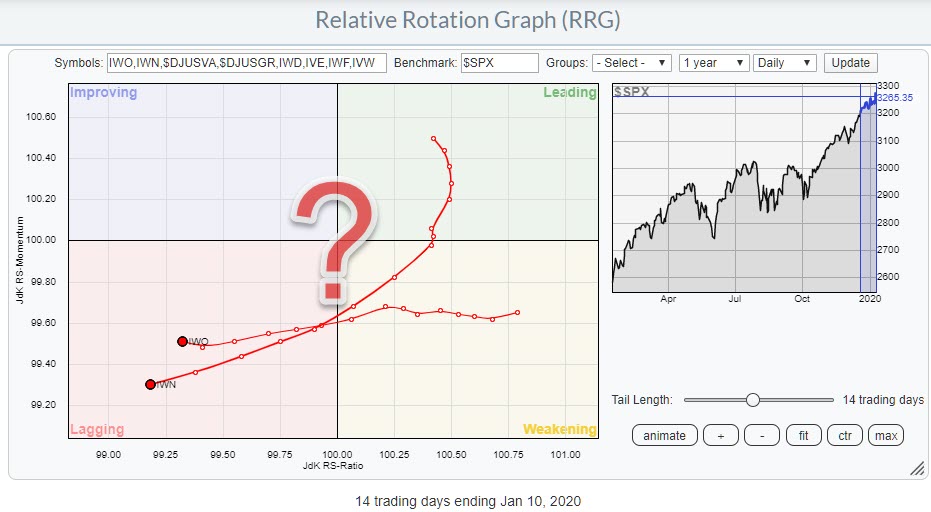
The RRGs above both use the (default) $SPX index as the benchmark. Very often, this will be a pretty good proxy, until it isn't. In this case, we are comparing the IWD and IWN ETFs that together cover the entire Russell 2000 index (IWM) to $SPX, which is only a subset.
Changing the benchmark to IWM will show the real rotation vs. the appropriate benchmark.
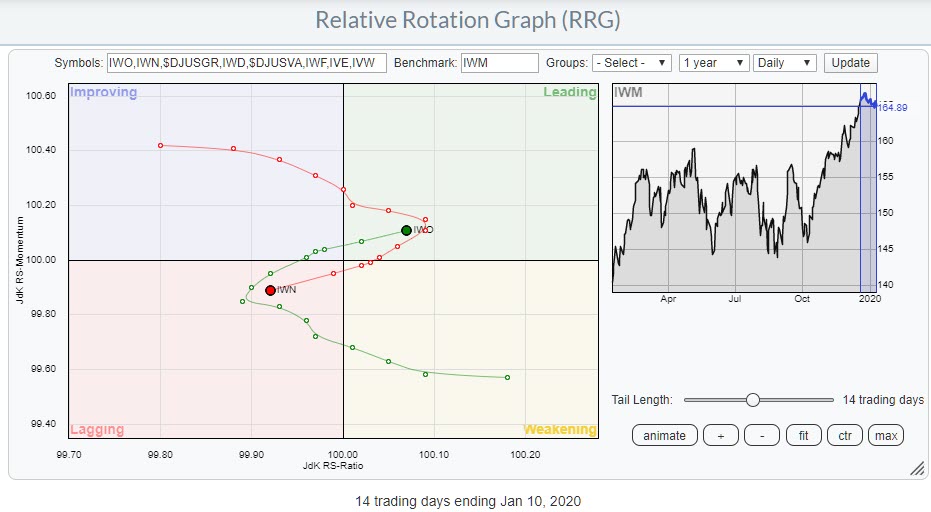
As you can see, the tails are now showing a similar rotational pattern as the other ETFs against $SPX.
The bottom line
The bottom line, in all cases, is that RRG shows a strong preference for Growth stocks over Value, no matter what provider family or underlying indexes you choose for your portfolio.
I hope this article explains a bit more in detail how you can get from an idea to an actual position with an investable instrument. If you would like to discuss this even more, please use DISQUS or email. We may even make it a topic for the next episode of Sector Spotlight, which airs tomorrow Tuesday 1/14 at 10.30am Eastern.
--Julius
Julius de Kempenaer
Senior Technical Analyst, StockCharts.com
Creator, Relative Rotation Graphs
Founder, RRG Research
Want to stay up to date with the latest market insights from Julius?
– Follow @RRGResearch on Twitter
– Like RRG Research on Facebook
– Follow RRG Research on LinkedIn
– Subscribe to the RRG Charts blog on StockCharts
Feedback, comments or questions are welcome at Juliusdk@stockcharts.com. I cannot promise to respond to each and every message, but I will certainly read them and, where reasonably possible, use the feedback and comments or answer questions.
To discuss RRG with me on S.C.A.N., tag me using the handle Julius_RRG.
RRG, Relative Rotation Graphs, JdK RS-Ratio, and JdK RS-Momentum are registered trademarks of RRG Research.
Julius de Kempenaer
Senior Technical Analyst, StockCharts.com
Creator, Relative Rotation Graphs
Founder, RRG Research
Host of: Sector Spotlight
Please find my handles for social media channels under the Bio below.
Feedback, comments or questions are welcome at Juliusdk@stockcharts.com. I cannot promise to respond to each and every message, but I will certainly read them and, where reasonably possible, use the feedback and comments or answer questions.
To discuss RRG with me on S.C.A.N., tag me using the handle Julius_RRG.
RRG, Relative Rotation Graphs, JdK RS-Ratio, and JdK RS-Momentum are registered trademarks of RRG Research.


