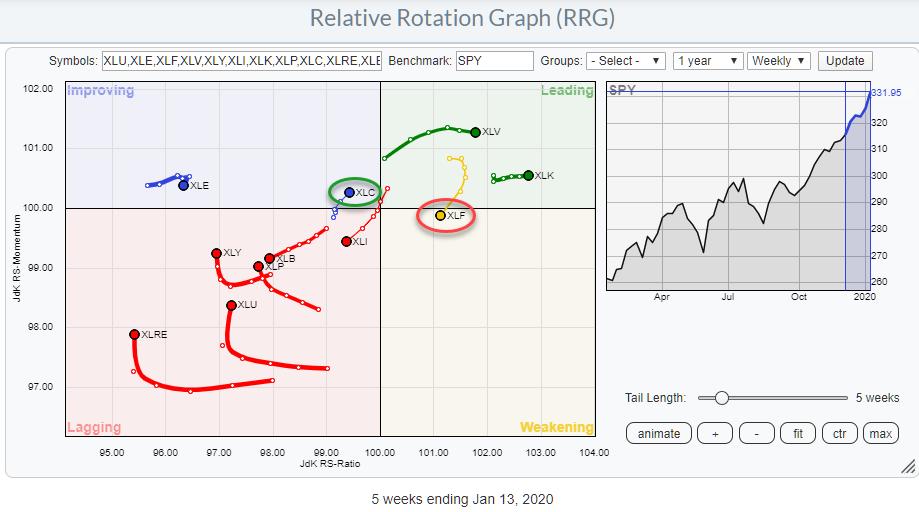
 Weekly RRG for US sectors
Here's a quick update for a rotation that caught my attention this morning.
Since the end of last year, XLF has started to give up on its leading role. JdK RS-Momentum started to decline and the tail began to roll over. Last week, XLF moved from the leading quadrant into the weakening quadrant.
That rotation in and of itself does not have to be dramatic, as there is still the possibility for a rotation through weakening back to leading without hitting the lagging quadrant. But, given the proximity to the 100-level on the JdK RS-Ratio scale, these odds do not seem too big.
However, inside the improving quadrant, we have XLC moving at a strong RRG-Heading and close to crossing over into the leading quadrant. This is an interesting relationship to investigate further.
Backed up by the Daily RRG
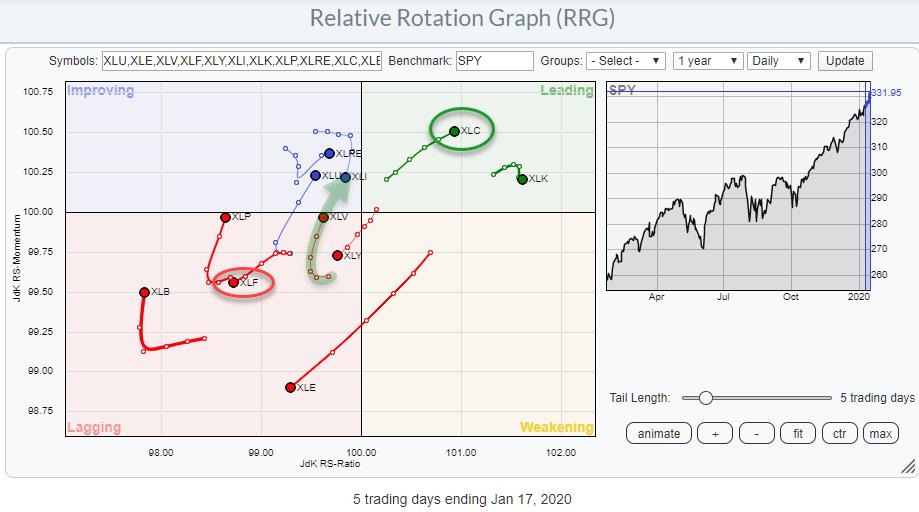 Daily RRG for US sectors
The improvement of the Telecommunication Services sector over Financials is also backed up by the rotational patterns on the daily Relative Rotation Graph.
Here, we find XLC well inside the leading quadrant and moving further into positive territory at a strong RRG-Heading, while XLF is inside the lagging quadrant and moving exactly opposite to XLC. This points to a relative downtrend that is underway on the daily timeframe and, given the positioning on the weekly chart, can quickly spill over to longer-term time frames.
XLC - XLF
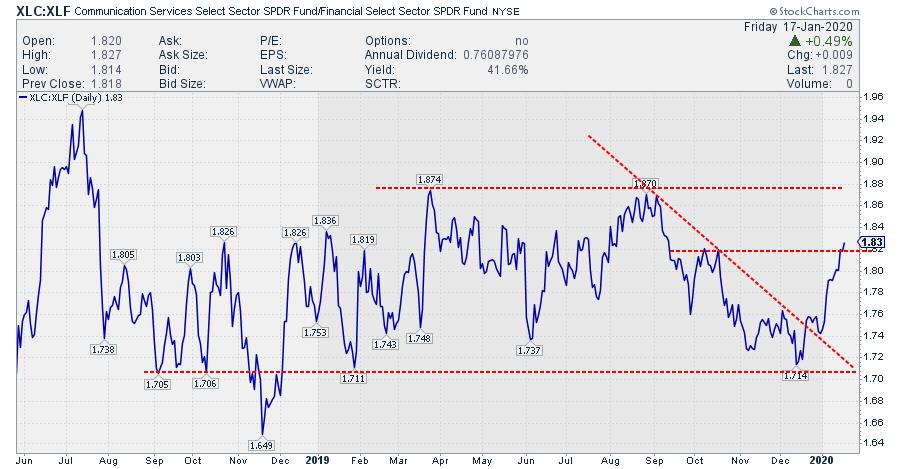 Daily Relative Strength of XLC vs XLF
The chart above shows the relative strength of XLC vs. XLF over the last 18 months. The range between 1.7 and 1.88 since the start of 2019 is clearly visible, as well as the break of the falling resistance line out of the September 2019 high.
With this ratio line now about to break some intermediate resistance levels, a rally towards the upper boundary of the range is very much possible.
--Julius
Julius de Kempenaer
Senior Technical Analyst, StockCharts.com
Creator, Relative Rotation Graphs
Founder, RRG Research
Want to stay up to date with the latest market insights from Julius?
– Follow @RRGResearch on Twitter
– Like RRG Research on Facebook
– Follow RRG Research on LinkedIn
– Subscribe to the RRG Charts blog on StockCharts
Feedback, comments or questions are welcome at Juliusdk@stockcharts.com. I cannot promise to respond to each and every message, but I will certainly read them and, where reasonably possible, use the feedback and comments or answer questions.
To discuss RRG with me on S.C.A.N., tag me using the handle Julius_RRG.
RRG, Relative Rotation Graphs, JdK RS-Ratio, and JdK RS-Momentum are registered trademarks of RRG Research.
Julius de Kempenaer
Senior Technical Analyst, StockCharts.com
Creator, Relative Rotation Graphs
Founder, RRG Research
Host of: Sector Spotlight
Please find my handles for social media channels under the Bio below.
Feedback, comments or questions are welcome at Juliusdk@stockcharts.com. I cannot promise to respond to each and every message, but I will certainly read them and, where reasonably possible, use the feedback and comments or answer questions.
To discuss RRG with me on S.C.A.N., tag me using the handle Julius_RRG.
RRG, Relative Rotation Graphs, JdK RS-Ratio, and JdK RS-Momentum are registered trademarks of RRG Research.


