
The Financial sector qualifies as an offensive, or cyclical, sector, together with Consumer Discretionary, Real-Estate and Materials.
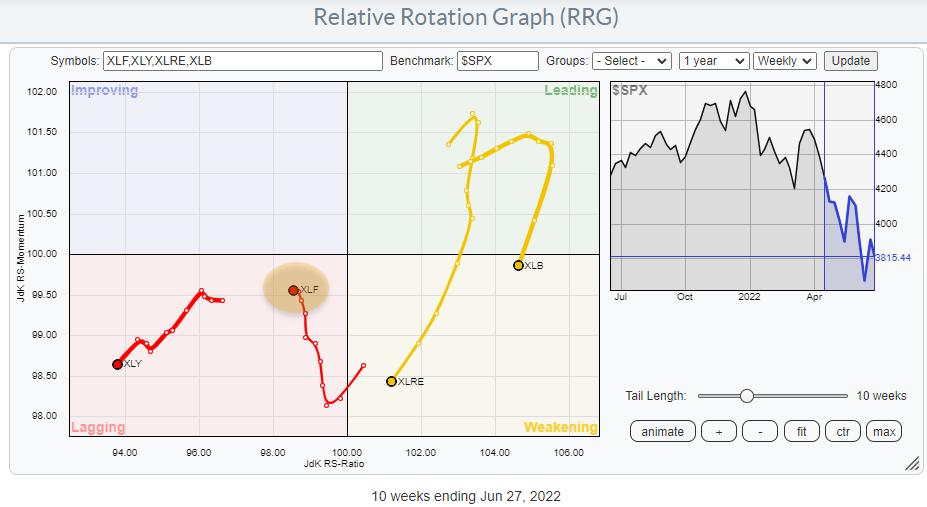
On the Relative Rotation Graph for sectors, XLF is showing up inside the lagging quadrant, signaling a relative downtrend vs. the benchmark (SPY). It is interesting to see that XLF is the only tail on this graph that is NOT moving at a negative heading (180-270). Over the last weeks, the Financials sector started to move higher on the JdK RS-Momentum scale. The sector still lost value on the JdK RS-Ratio scale, but much less fast.
Although all cyclical sectors are still either inside the lagging quadrant or traveling (back) towards it at a negative heading, XLF seems to be at least going slightly against the tide. Time to investigate what's going on inside the sector.
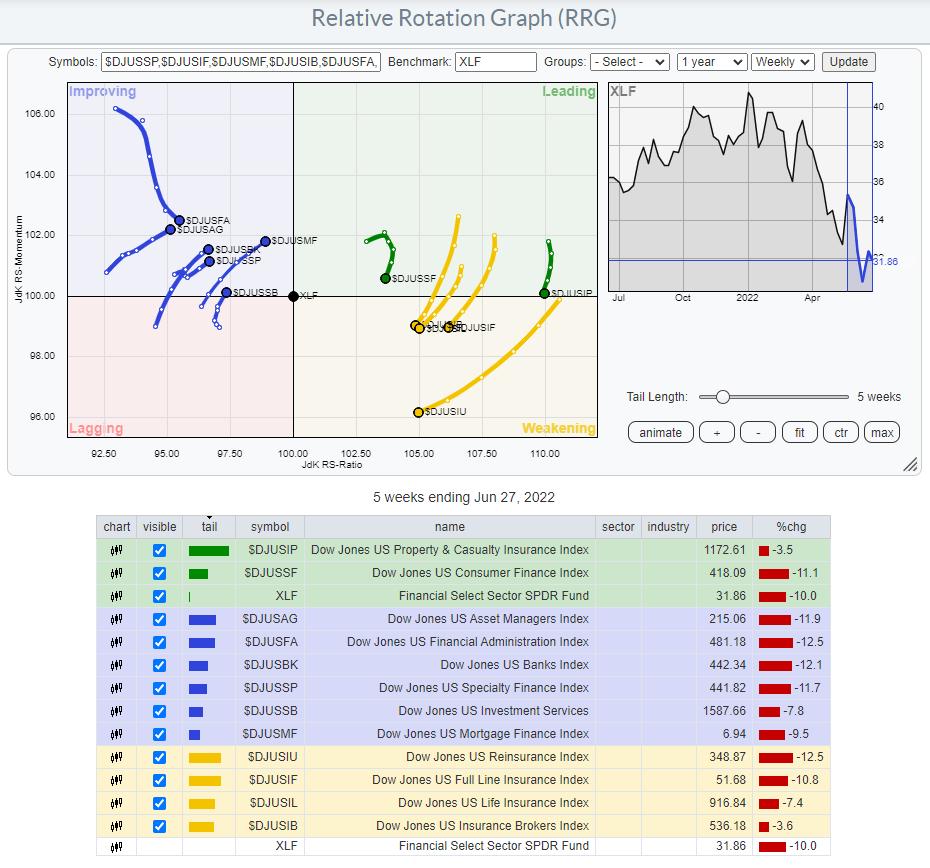
This RRG shows the groups inside the Financials sector, and it is immediately apparent that the sector is divided into two camps. One cluster of groups is on the right-hand side of the RRG, but all rotating at a negative RRG-Heading. The other cluster is on the left-hand side of the RRG, inside the improving quadrant, with all but one rotating at a strong RRG-Heading.
A quick check of the table below the graph shows that the groups inside the weakening quadrant are all insurance-related groups. Inside the leading quadrant is one more insurance group, Property & Casualty Insurance, and Consumer Finance. The only group inside the improving quadrant that is NOT moving at a strong RRG-Heading is the Financial Administration index. All others are on a strong trajectory towards the leading quadrant, with Mortgage Finance leading the way.
The last time I wrote about the financials sector was in this article in January. At that time, the insurance groups had just rotated into the leading quadrant and they were leading the sector. Setting the tail length to 23 weeks will show the performance of all groups since the week of Jan 18.
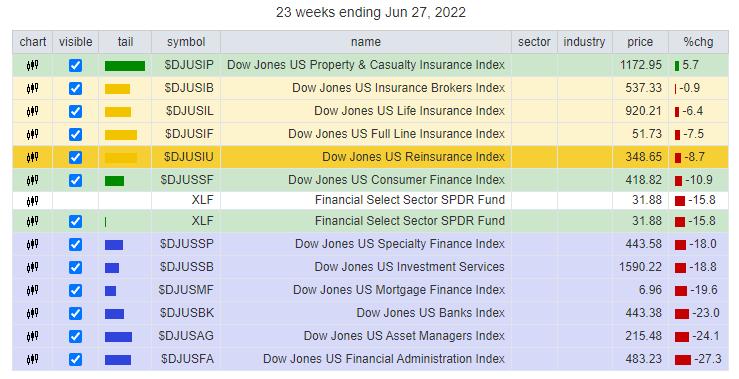
The insurance-related groups, which are now inside the weakening quadrant, are all showing up at the top of the list and above XLF. They have all outperformed the Financials sector index. The Property and Casualty index even managed to get a positive return.
But!! This period of outperformance for these groups seems to be coming to an end now, as money is rotating away from them and into the groups that are currently inside the improving quadrant.
It is interesting to see how different the charts in these two groups are looking.
US Reinsurance Index
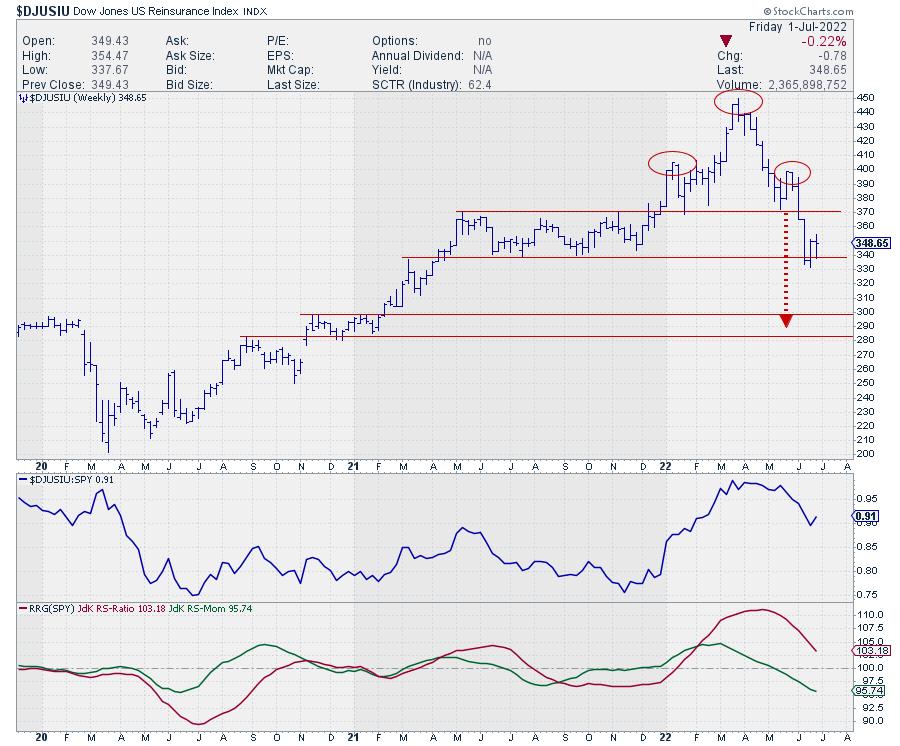
The Reinsurance index, which was one of the strong groups in January, has now rolled over and formed a large H&S top formation in the first half of 2022. The neckline, which was perfectly horizontal at 370, was broken three weeks ago. The initial decline took the group down to around 340, where support was found coming from the lower boundary of the 2021 range.
The target area, based on the height of the H&S pattern, is around 290. In the near-term, a bounce from current support back to the breakout level is possible, but such a move, when it happens, should be seen as a selling opportunity.
When this index breaks to new lows in the coming weeks, a further decline towards the 290 area is likely.
US Mortgage Finance Index
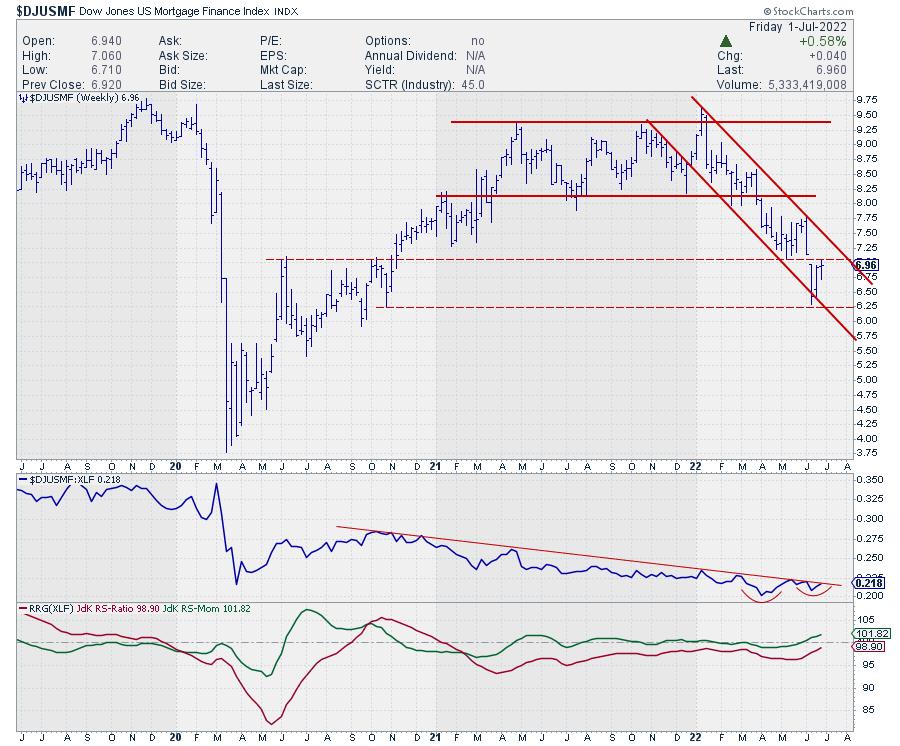
This group is still inside the improving quadrant, but at the longest tail and closest to crossing over into leading while at a strong RRG-Heading.
The price chart shows a falling trend channel after this group broke downward from a broad range at the start of this year. The index recently found support around 6.25 and is now pushing against double resistance coming from the down-gap and the previous low in the area around 7.00.
The interesting thing is the gradual improvement of relative strength. In the raw RS-line, a first higher low is visible, as it is trying to break the falling resistance line of the relative highs since mid-2020. This improvement, which is essentially a slowing down in the decline, has caused the RRG-Lines to gradually approach the 100-level. The RS-Momentum line has now already crossed above that level and RS-Ratio is closing in.
From a relative point of view, this makes Mortgage Finance a very interesting group. From a price perspective, it would help if we could hold above that support level near 6.25, then break back above 7.00 to support a further rise in relative strength.
All in all, it is very clear that money is rotating out of the insurance groups, and at least some of that money is moving into Mortgage finance and the other groups inside the improving quadrant.
#StaySafe and have a great weekend, --Julius
Julius de Kempenaer
Senior Technical Analyst, StockCharts.com
Creator, Relative Rotation Graphs
Founder, RRG Research
Host of: Sector Spotlight
Please find my handles for social media channels under the Bio below.
Feedback, comments or questions are welcome at Juliusdk@stockcharts.com. I cannot promise to respond to each and every message, but I will certainly read them and, where reasonably possible, use the feedback and comments or answer questions.
To discuss RRG with me on S.C.A.N., tag me using the handle Julius_RRG.
RRG, Relative Rotation Graphs, JdK RS-Ratio, and JdK RS-Momentum are registered trademarks of RRG Research.


