
RRG ChartsJanuary 03, 2025 at 09:37 AM
HAPPY NEW YEAR!!! Ever since the introduction of RRG back in 2011, many people have asked me questions like: "What is the track record for RRG" or "What are the trading rules for RRG"? My answers have always been, and will continue to be, "There is no track record for RRG, as the...Read More
RRG ChartsDecember 19, 2024 at 05:30 PM
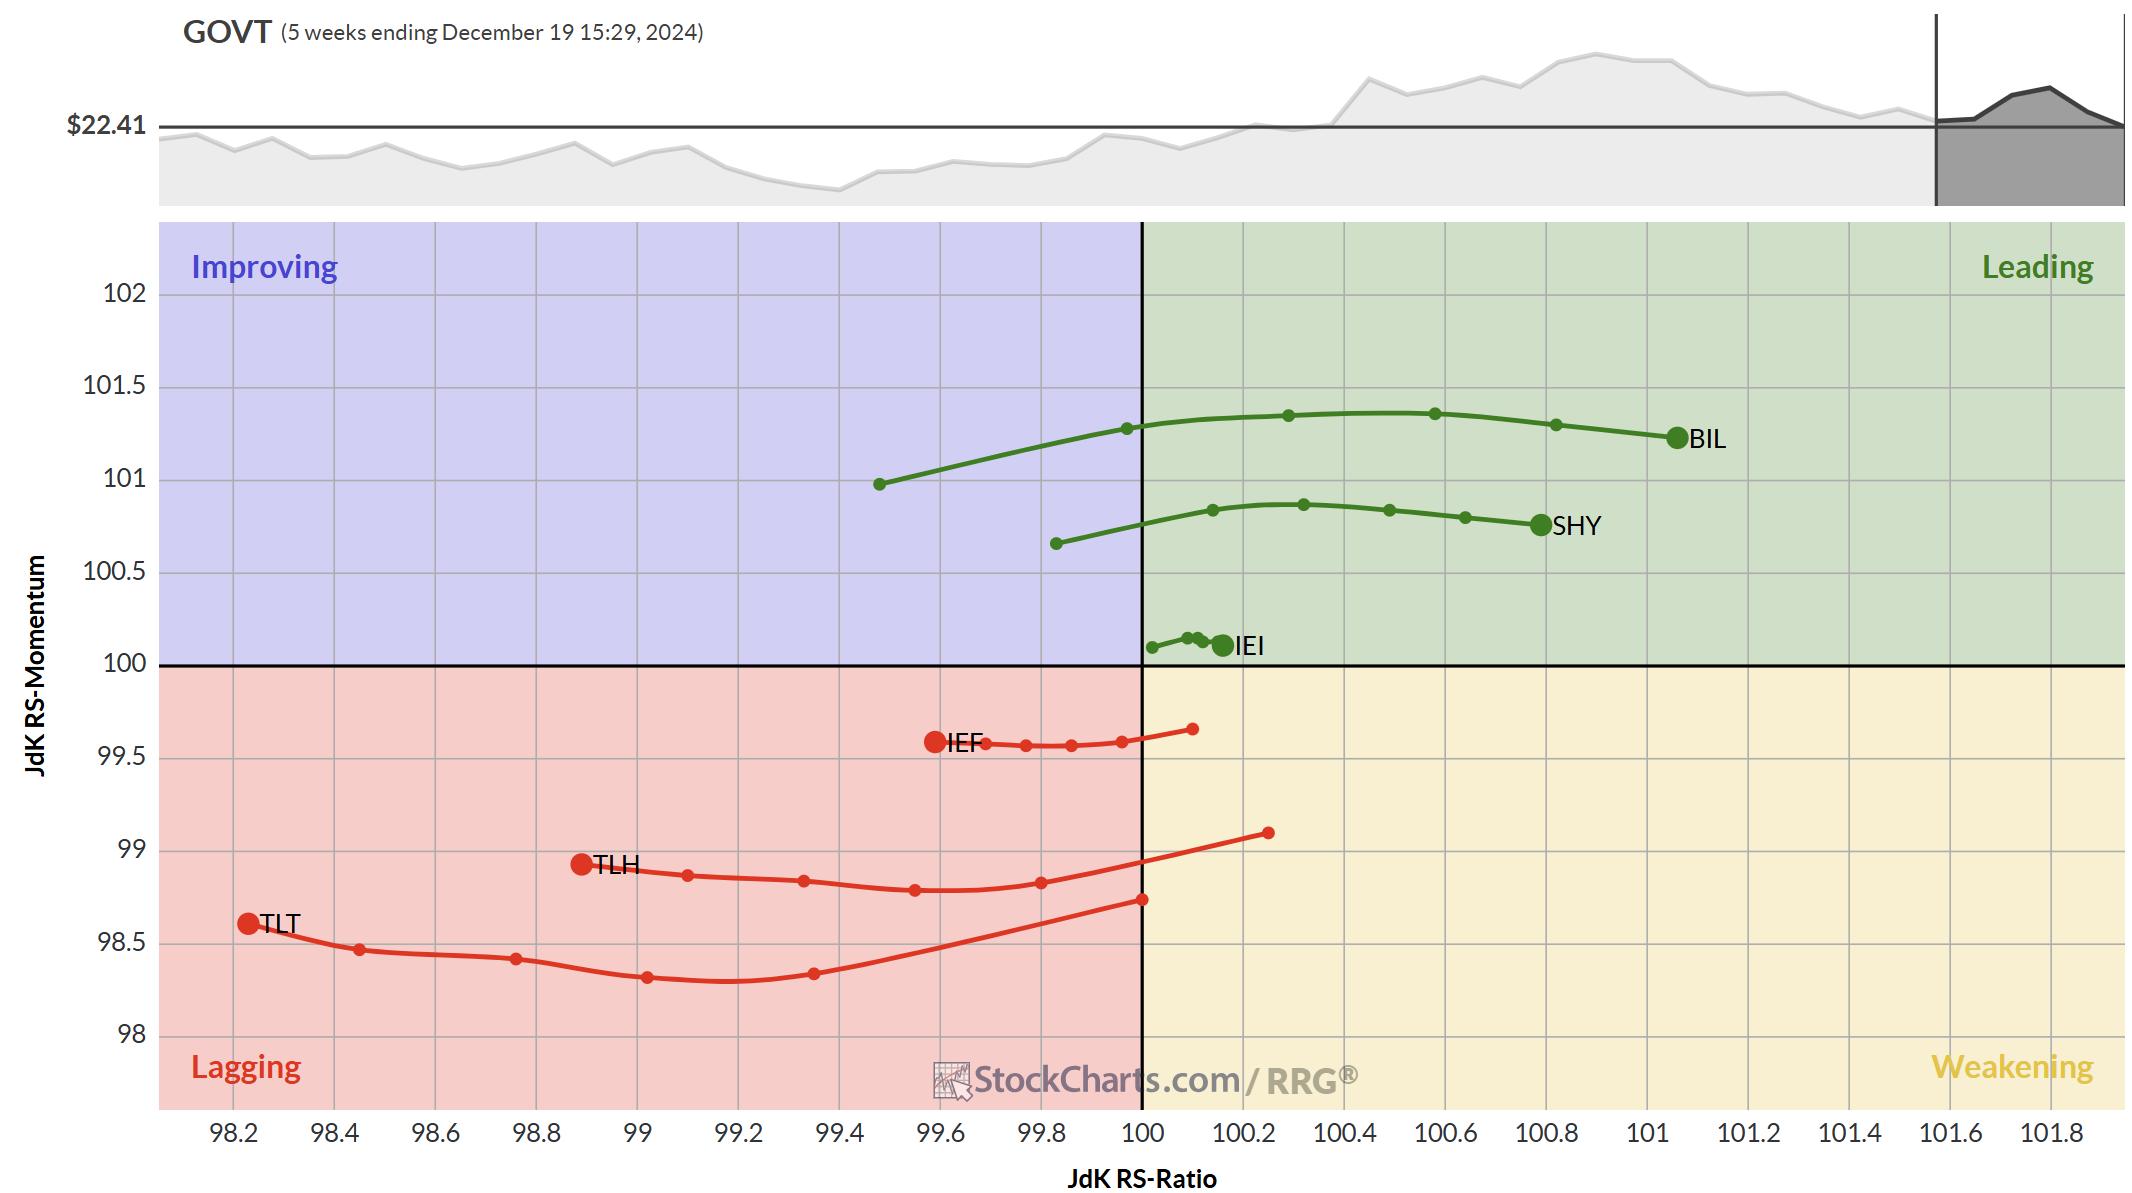
The Yield Curve The RRG above shows the rotations of the various maturities on the US-Yield Curve...Read More
RRG ChartsDecember 11, 2024 at 02:48 PM
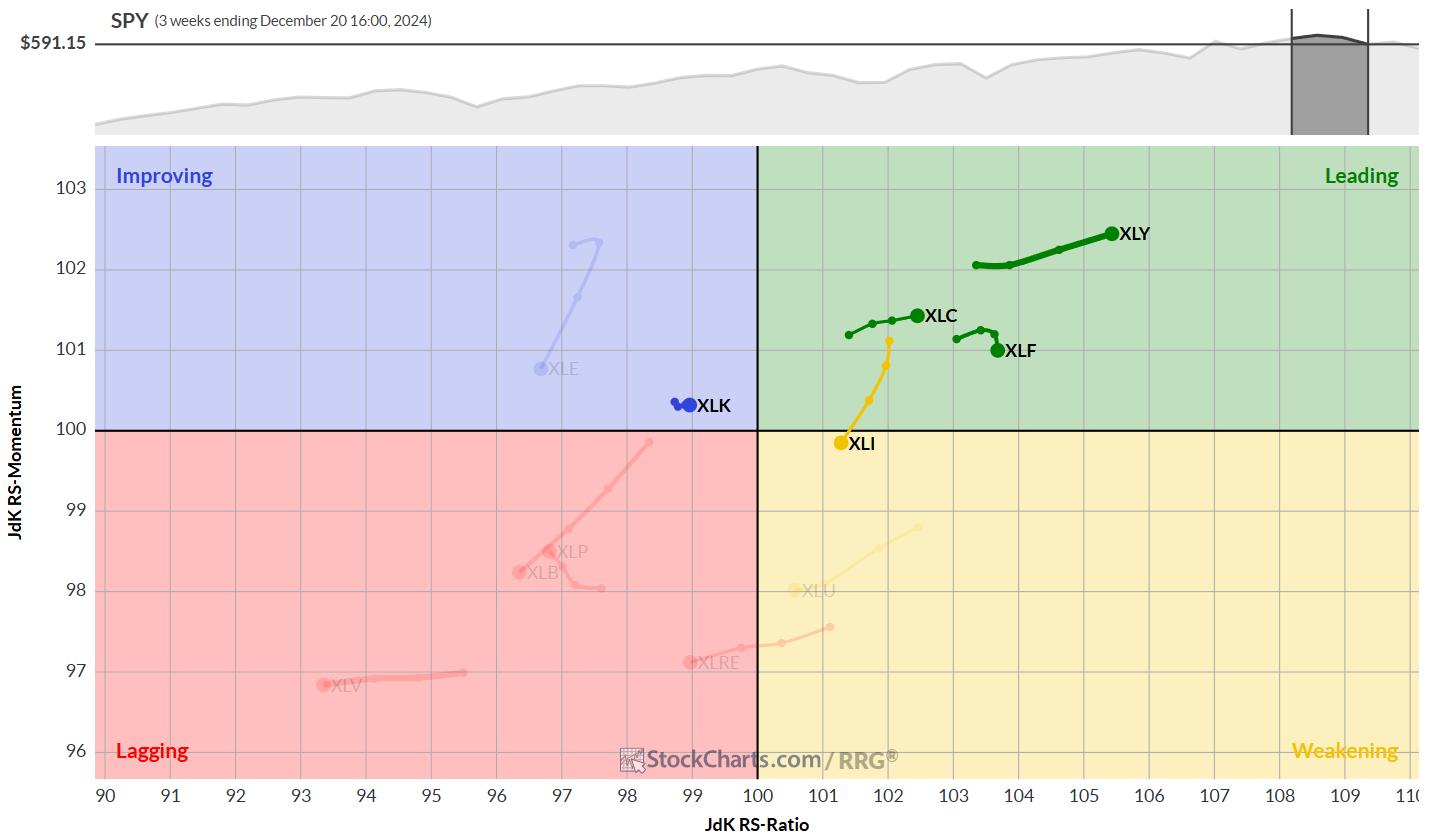
In this exclusive StockCharts video, Julius gives a quick update on sector rotation, then examines the strength uncovered in Consumer Discretionary...Read More
RRG ChartsDecember 06, 2024 at 02:45 PM
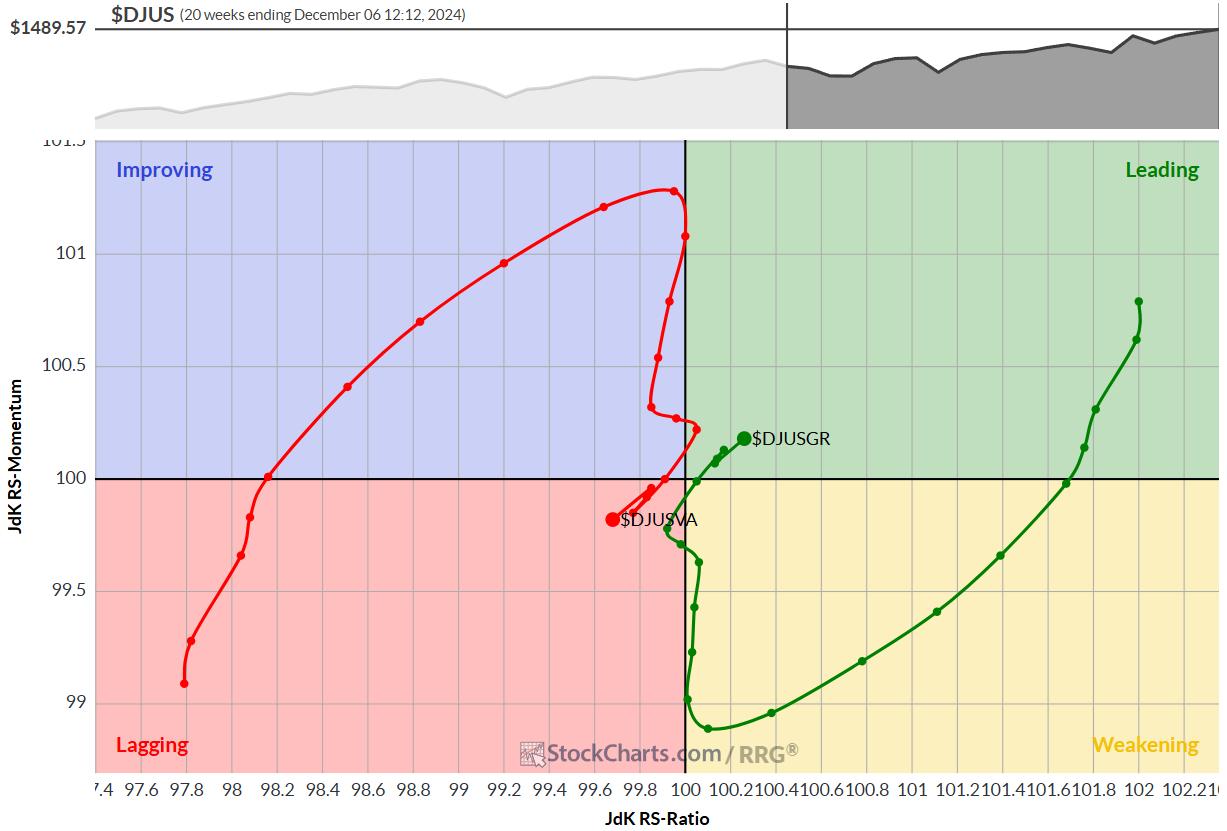
Growth vs. Value Rotation: The Pendulum Swings Again Relative Rotation Graphs (RRG) are not just good tools to use in analyzing sector rotation; they're also a valuable means for visualizing other market dynamics...Read More
RRG ChartsDecember 02, 2024 at 06:22 PM
In this exclusive video, Julius analyzes the completed monthly charts for November and assesses the long-term trends for all sectors...Read More
RRG ChartsNovember 27, 2024 at 02:14 PM

In this video from StockCharts TV, Julius takes a deep dive into US sector rotation, breaking it down into offensive, defensive and cyclical sectors...Read More
RRG ChartsNovember 20, 2024 at 05:02 PM
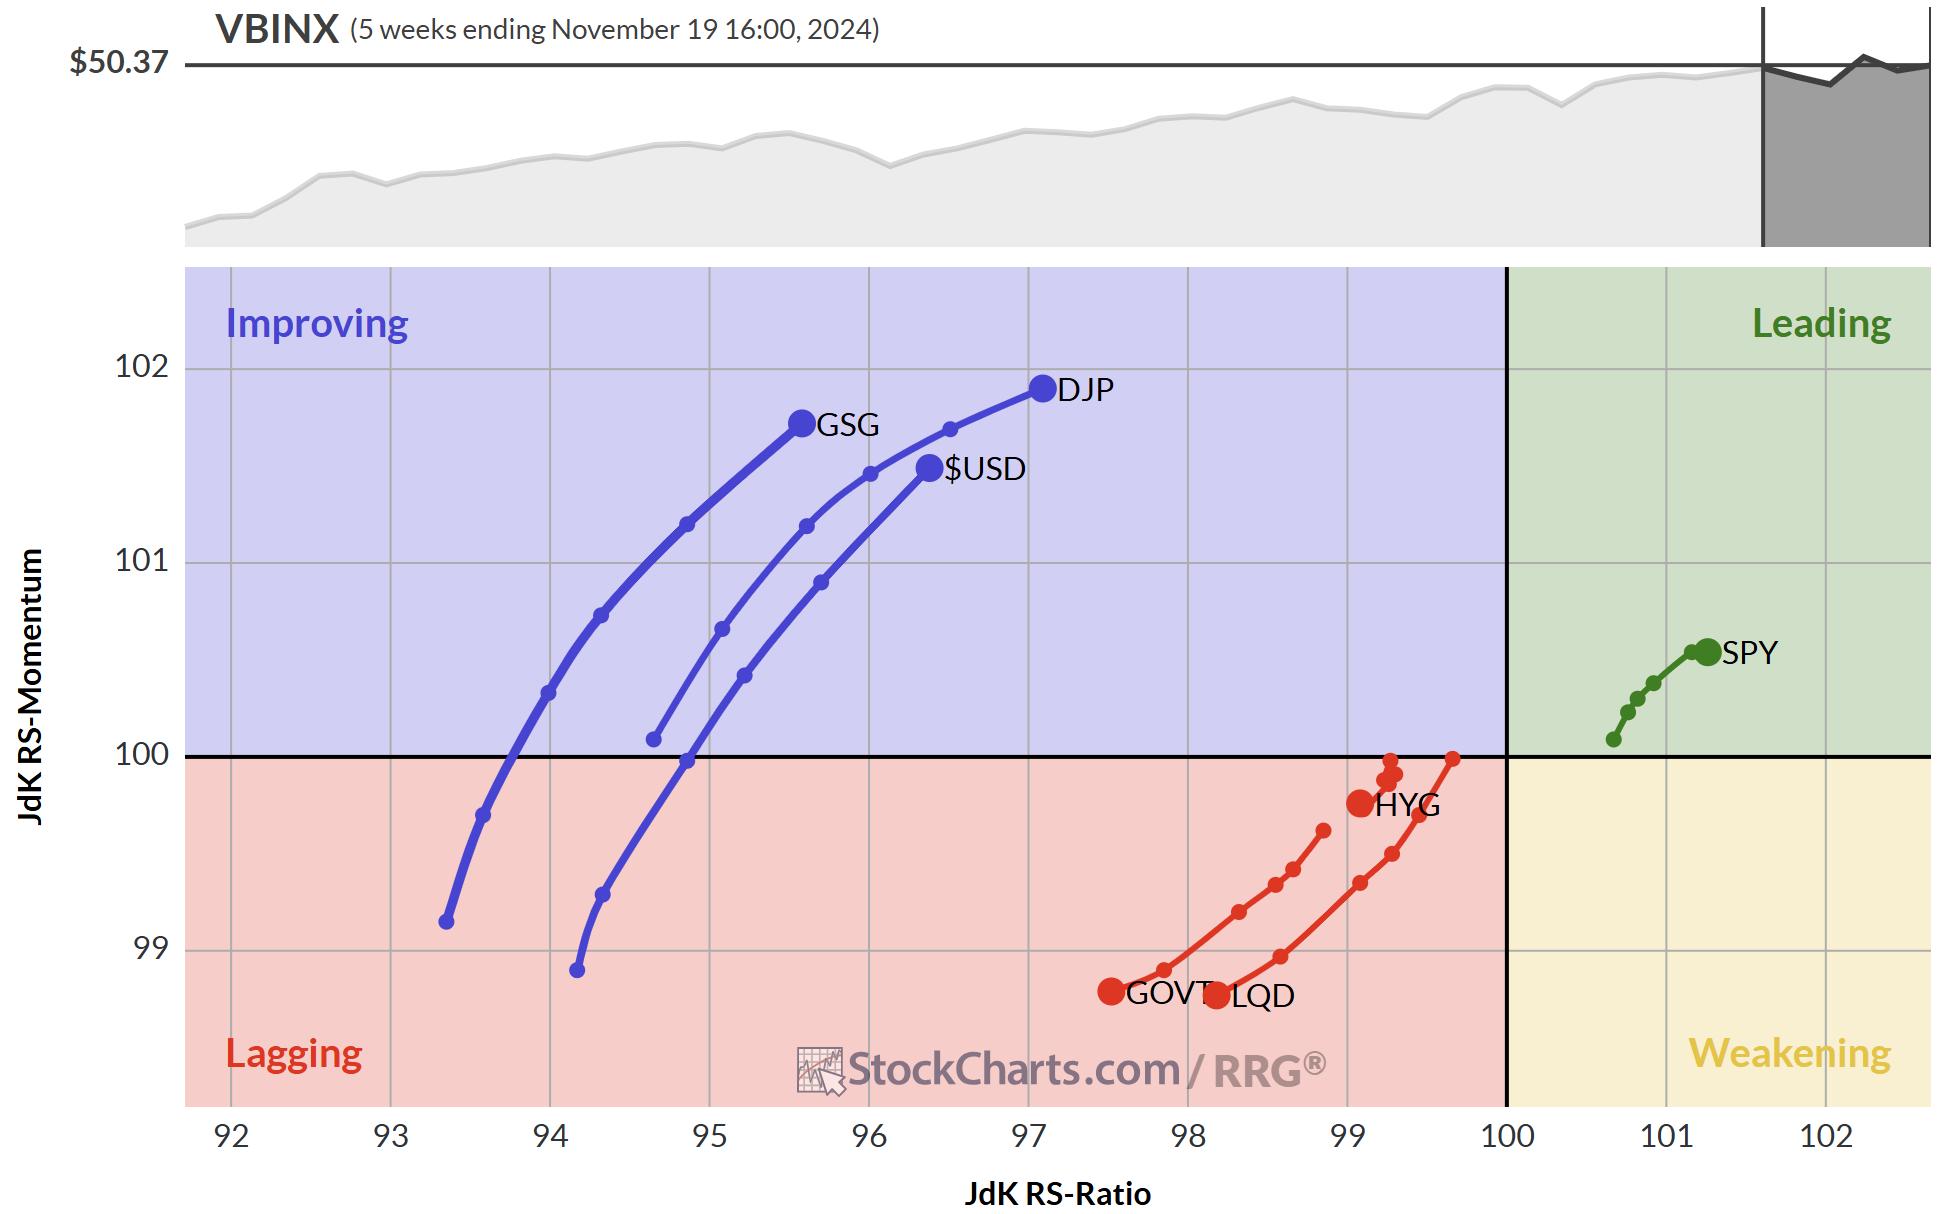
After the election, things have hardly settled in the world. New developments in the Ukraine-Russian conflict and the Middle East are still volatile. Worst of all, I am in Redmond, WA this week, where last night's storm caused a massive power outage in this region...Read More
RRG ChartsNovember 11, 2024 at 06:18 PM
In this video from StockCharts TV, Julius pulls the curtain back on the updated Relative Rotation Graphs that are now available on the StockCharts website...Read More
RRG ChartsNovember 08, 2024 at 04:34 PM
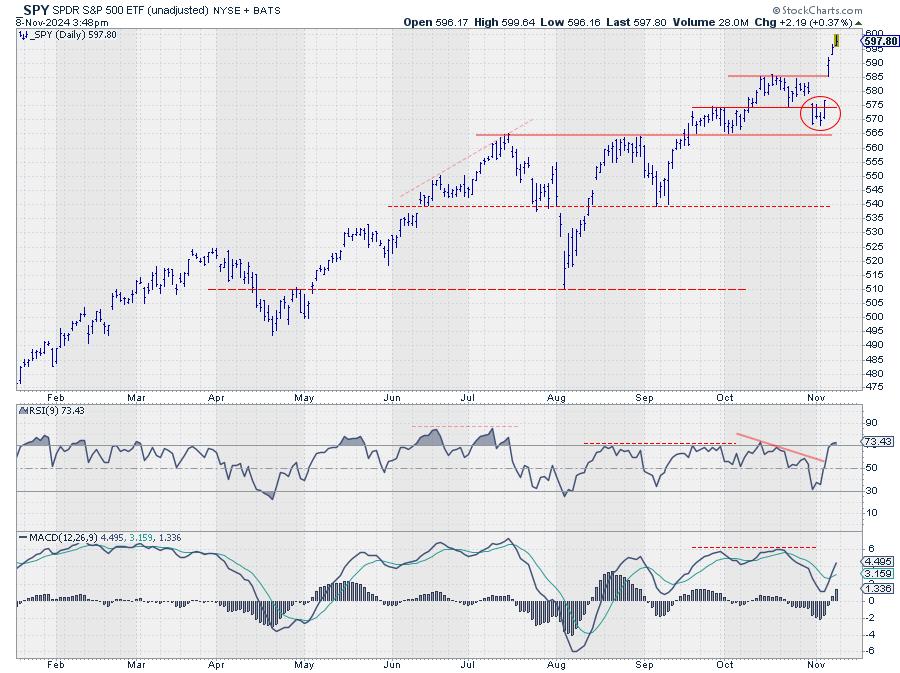
First of all, for those of you looking for a new video this week, I have intentionally skipped it because I didn't want to make a video right before such an important event with much uncertainty...Read More
RRG ChartsNovember 01, 2024 at 07:45 PM

In this video from StockCharts TV, Julius begins by looking back at the completed monthly bars for October to assess the long term trends in the 11 S&P sectors. He follows that up with an updated view for SPY in coming weeks...Read More