
RRG ChartsAugust 13, 2024 at 05:55 PM

In this video from StockCharts TV, Julius assesses various rotations using Relative Rotation Graphs, starting at asset class level and then moving to sectors...Read More
RRG ChartsAugust 02, 2024 at 02:49 PM

And then ..... all of a sudden..... things are heating up. Lots of (downside) market action in the past week. Let's see what sector rotation and RRGs can tell us. The RRG at the top is a daily RRG, as recent price action has significantly impacted near-term rotations...Read More
RRG ChartsJuly 26, 2024 at 03:14 PM
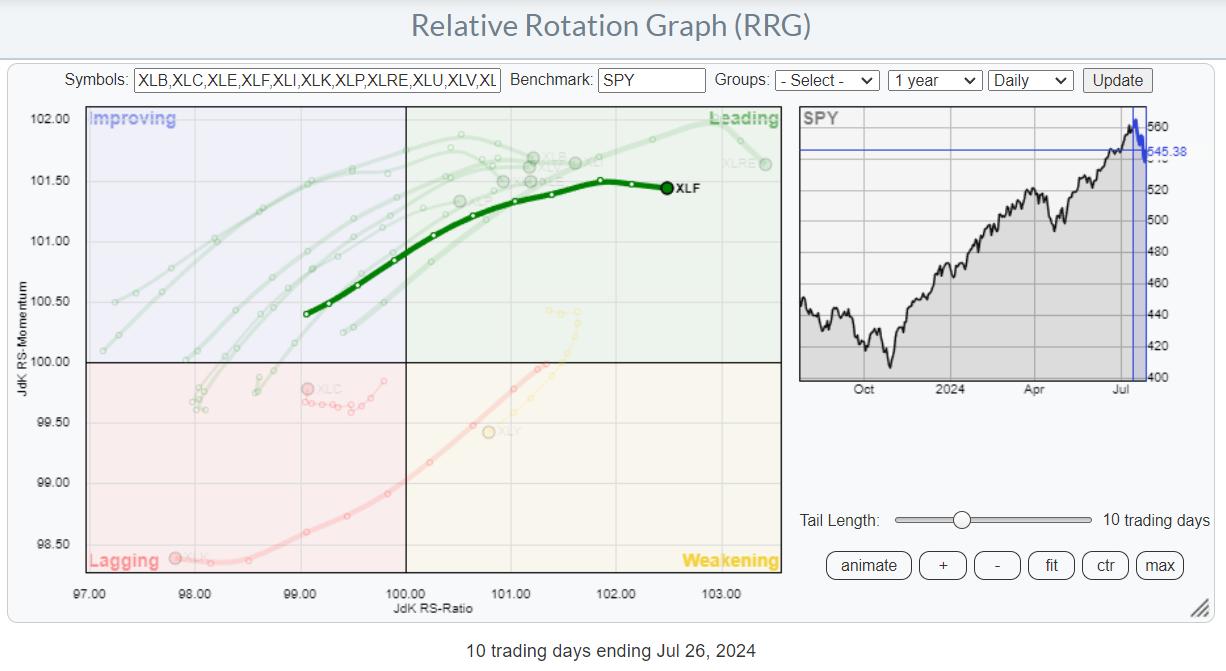
Flying Financials In the recent sector rotation, basically OUT of technology and INTO anything else, Financials and Real-Estate led the relative move. On the RRG above, I have highlighted the (daily) tail for XLF to show how it stands out from the other sectors...Read More
RRG ChartsJuly 23, 2024 at 02:40 PM

In this video from StockCharts TV, Julius takes a look at the markets through the lens of the "market factors" panel you can find on your StockCharts dashboard...Read More
RRG ChartsJuly 18, 2024 at 06:23 PM

Strong Rotations on Daily RRG This daily RRG shows the sector rotation over the last five days. With only one more trading day to go (Friday, 7/19), the emerging trends are becoming clearer...Read More
RRG ChartsJuly 16, 2024 at 12:59 PM

In this video from StockCharts TV, Julius looks at the markets from an asset allocation perspective using various RRGs. Stocks are (still) beating bonds, while commodities are rotating out of favor and the USD is losing steam...Read More
RRG ChartsJuly 09, 2024 at 02:53 PM

In this video from StockCharts TV, Julius continues to look at the narrowing market breadth and puts things into (another) perspective. The conclusion remains the same: it's a Risk-ON market, but the Risk is BIG. This video was originally broadcast on July 9, 2024...Read More
RRG ChartsJuly 04, 2024 at 05:12 PM

There's been much chatter and mentions of weak or narrow breadth floating around these days. I plead guilty as well. But I now want to approach this from another angle using some of the major US stock indices for this article...Read More
RRG ChartsJuly 02, 2024 at 01:34 PM

In this video from StockCharts TV, Julius assesses the long-term trends as they are playing out on the monthly S&P 500 sector charts. He takes a look into the future using the expected seasonal trends for the month of July...Read More
RRG ChartsJune 25, 2024 at 01:36 PM

In this video from StockCharts TV, Julius takes a look at rotation among growth/value and size segments, followed by a look at current sector rotation. He detects an intraday sector rotation he has never seen before, which could be the prelude for a larger move...Read More