|
|
This tutorial will show how to view ticker symbols and market capitalization within the Market Carpet.
Market Carpets are good to quickly visualize performance for a large group of stocks. By adding the ticker symbols to the Market Carpet, users can easily see which stocks are outperforming and which are underperforming. Viewing in market capitalization mode allows users to see which stocks exert the most influence on market capitalization weighed indices.
Isolating the Technology Sector in the S&P Sector Carpet

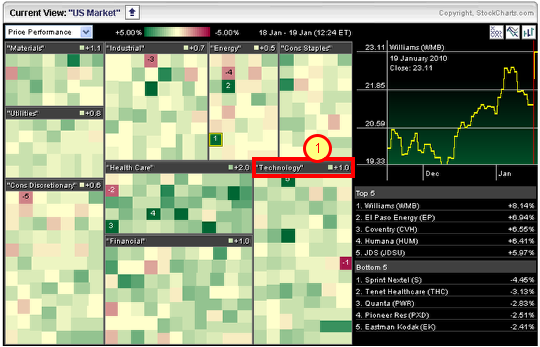
From the Free Charts page, we will start with the S&P Sector Carpet. This link can be found near the bottom of the third column on the Free Charts page. The default view shows all nine sectors based on price performance (percentage change or loss). Click on the "Technology" heading to isolate this sector.
Hover and Right Click to View Options

After clicking the technology heading, we will see only the technology sector carpet. The positive numbers show the top five performers. The negative numbers show the five bottom performers. Hover over the green-red boxes and right click on the mouse to view options. Click “Show Ticker Symbol” to place the tickers in all the boxes. This provides instant stock identity.
Viewing Market Capitalization

We can take this a step further by viewing both tickers and market capitalization. Again, hover over the carpet and right click on the mouse to view options. Click "Market Cap Mode" to show box sizes according to Market Cap. The bigger the box, the bigger the market cap.
Many Other Options

Microsoft has the biggest box because it has the largest market capitalization within the S&P technology sector. As you may have noticed, there are other options available by hovering and right clicking on the mouse. Users can view "Long Term Mode" or even "Animate" to see changes over time. Check it out!

