|
|
Using ChartNotes, our annotation tool, you can add trendlines, text, arrows and much more to any chart. This tutorial shows you how to add Fibonacci Retracements.
Click "Annotate(Flash)" Link Below the SharpChart

Create the SharpChart for which you want to add Fibonacci Retracements to. Make sure the chart is exactly what you want to use before starting ChartNotes!
Once you start annotating a chart, you cannot change the time period. After creating a SharpChart with the exact settings you want, click the "Annotate (Flash)" link located immediately below the chart. (If the Flash version doesn't work correctly, try clicking the "Annotate (Java)" link instead.)"
A new annotation window should appear on top of your chart. This is our "ChartNotes" annotation tool.
Draw Your Fibonacci Retracements
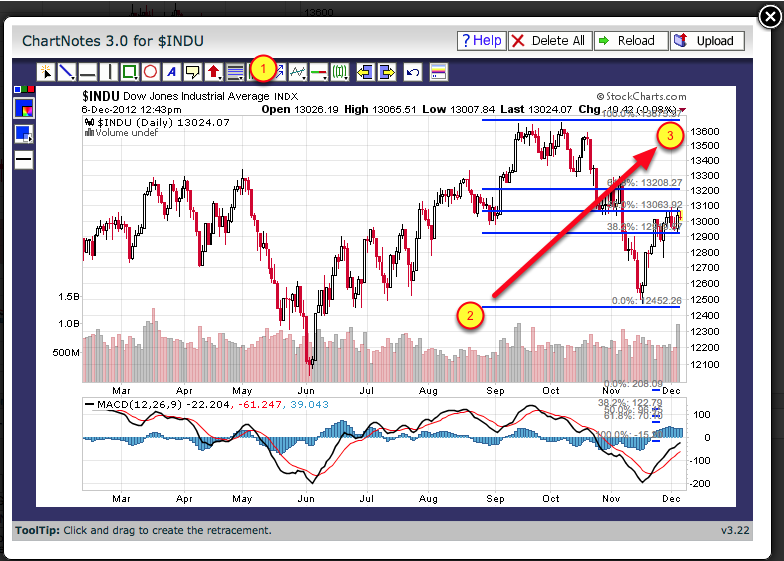
When ChartNotes is ready, first click on the Fibonacci Retracement tool in the toolbar at the top of the window (#1). Next, click-and-hold your mouse at the start of a significant price move (#2), then drag your mouse to the end of that price move (#3) while continuing to hold down the mouse button. The Fibonacci retracement lines should appear as you drag your mouse.
NOTE: If you'd like additional Fibonacci Retracement levels in addition to the 5 we normally display, hold down the Ctrl key (Command on the Mac) while dragging your mouse.
Upload Your Chart
Members can upload the annotated chart to a Favorites list. Click on the "Upload" button to uploade the chart to a Favorites list. If you have not saved the chart before, it will ask you what list to save it to. Non-Members can save a copy of an annotated chart to their local hard disk using a screen capture utility such as HyperSnap.
Learn more about using ChartNotes
To learn more about using ChartNotes, please see the User Guide


