
What an unconvincing start to a year “ending in 5” (usually one of the best in the decennial pattern). With the shock Swiss National Bank announcement fading away, China GDP numbers behind us and the ECB Quantitative Easing program just released, can the market finally get ahead to confirm a positive January and, for what it’s worth, brighten our prospects for the rest of the year.
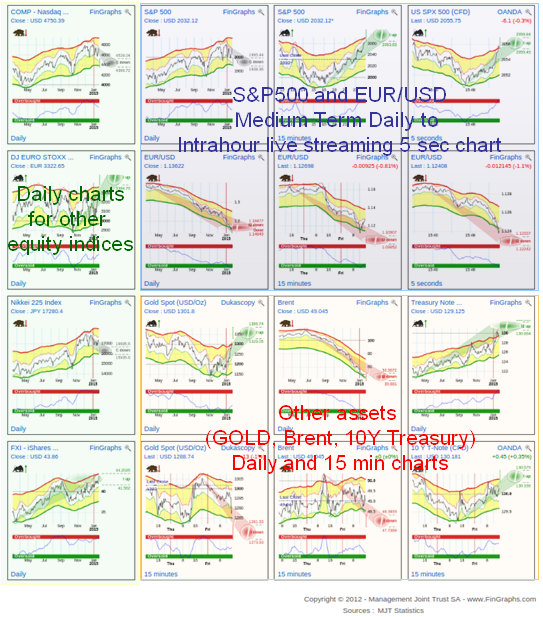
But, before we jump into looking at the market, we would like to highlight one of the newer functionalities available on FinGraphs.com. The feature is called “MyMosaic”. It allows you to choose from any instrument and frequency in our database to create your custom monitoring screen. You can combine Long term with Intrahour across all asset classes. For example:
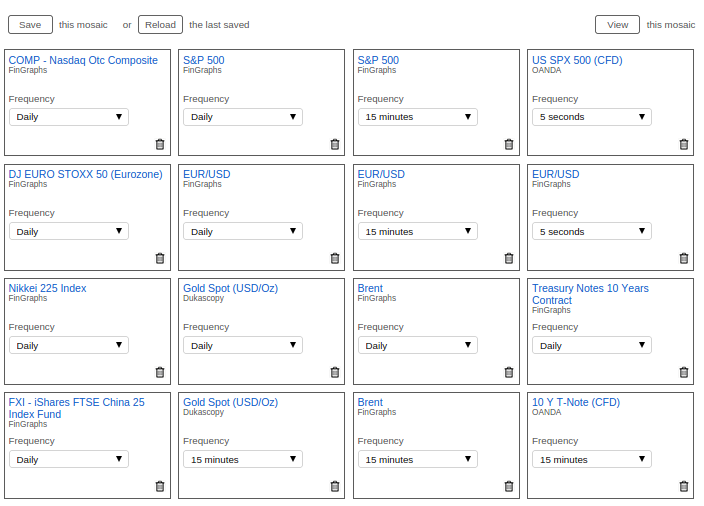
Setting-up a MyMosaic is intuitive. After having inserted the symbols in a MyMosaic, the panel below will allow to choose the frequency for each item as well as drag & drop each box into position.
More utilisation information can be found in the following pdf link :
http://www.fingraphs.com/static/FinGraphs2/pdf/MyMosaicsUserguide.pdf
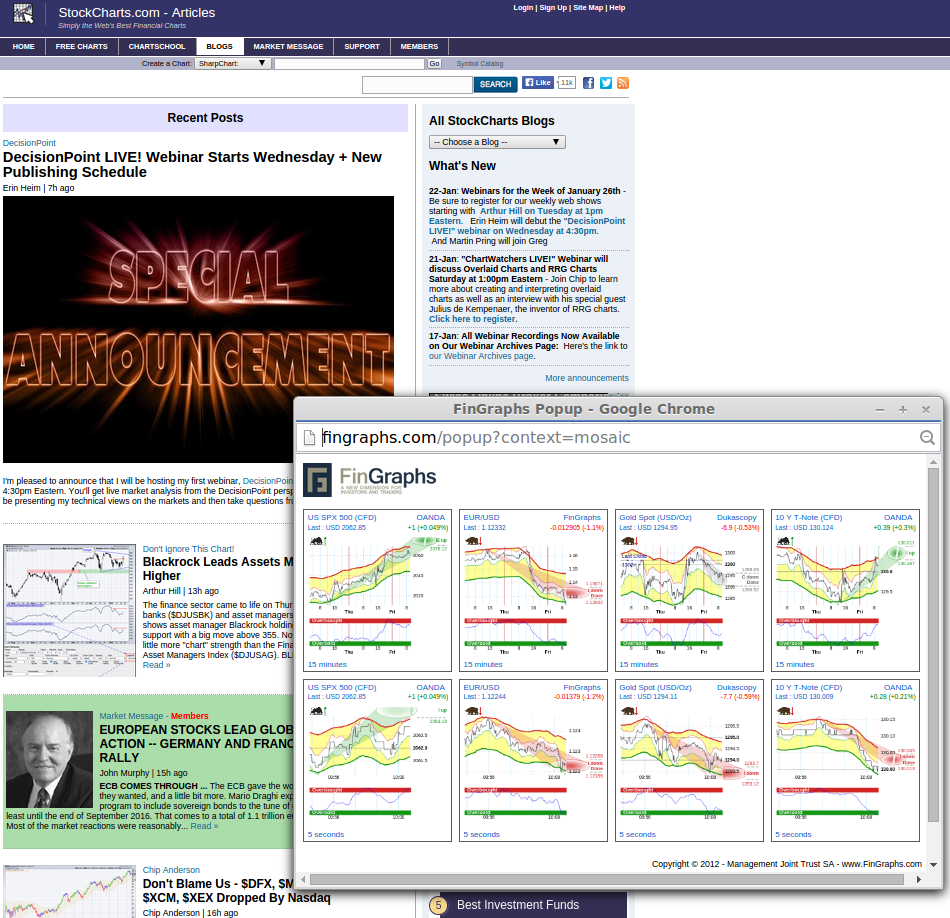
Finally, you may also pop-up a MyMosaic and let it stream next to other windows on your screen(s): never lose track of your trend analysis while reading news or trading the market.
Now back to the S&P500 and its Investor’s View below (i.e. a combination of a Weekly, Daily and Hourly chart):
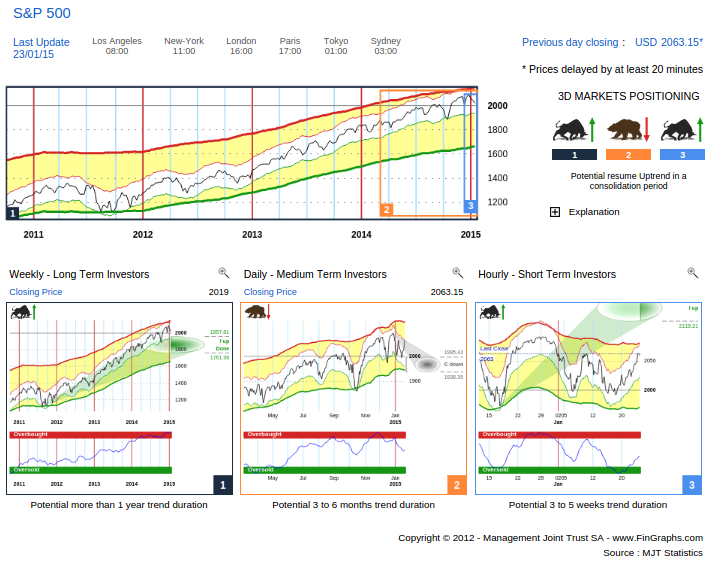
The Weekly (left hand chart) is still in a “Bull”. The recent price correction has cast doubt over the Impulsive 2 targets that were presented a few weeks back on this Weekly chart. The market would have to resume its uptrend and push higher again so that these extended targets are reignited (for reference, these were pointing to levels between 2’200 and 2’400 over the next few quarters). As of today, we are still waiting for this confirmation and the targets are labelled “Impulsive done”. Such exhaustion should remind us that although the market is still trending up, the remaining price potential is tentative and limited. The Risk Index in this Weekly chart (a bounded medium term oscillator) confirms this extended situation: it is well Overbought. That said, it would need to turn and start trending down to mark a significant top.
The Daily (middle chart) is still in a correction down. This consolidation period has been quite shallow for now. Last week, prices have briefly touched the upper boundary of our corrective target zone down. They are now moving back up towards their recent highs. Although, we cannot confirm a “resume Uptrend situation” yet, the correction in the Risk Index has created some breathing space: this oscillator could be ready to move higher again.
The Hourly (right hand chart) is back in an Uptrend with Targets pointing to new highs. A recent Oversold bottom on the Risk Index and its current ascending trend out of this Oversold zone do give some credibility to this new ascending trend.
Late in December, in our Year End market review, we mentioned that we really wanted to see some rotation into the cyclical sectors to confirm the US cyclical upturn.
http://stockcharts.com/articles/tac/2014/12/fingraphs-following-the-trends-into-2015.html
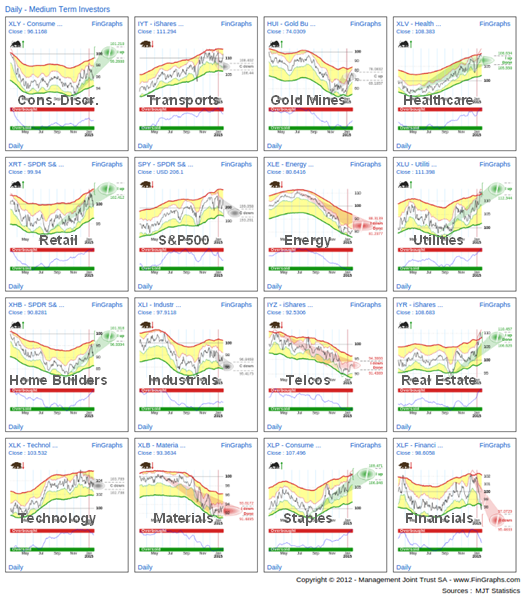
As shown on the following Daily Mosaic featuring a selection of relative charts of US sectors vs the S&P500 SPY ETF, the recent consolidation has seen renewed relative strength from the Defensive sectors (Staples, Healthcare, Utilities). Over the next few weeks, we would need to see some rotation back into the early cyclical sectors (Consumer Discretionary, Retail, Home Builders, Technology) to confirm that this extended Bull market still has some potential.
For more information on our methodology click here (http://www.fingraphs.com/#couponid-STKCHARTS14) and then visit ‘About Us/Press release’ and ‘User Guide’ sections of our website. Clicking that link also qualifies you for a 7 day demo and a 10% discount on our services if you choose to subscribe.
Have a great weekend, J-F Owczarczak (@fingraphs)