
Buy Zones Of the Dark Pools
Technical Traders have the advantage over fundamentalists in terms of being able to buy low and sell high. Certain indicators provide Bottom and Topping patterns that appear before the bottom actually commences, and prior to a top starting the big downside High Frequency Trader HFT sheer cliff drop.
Bottoming patterns are most easily seen with indicators that combine Quantity, Price, and Time. Keep in mind that Price and Time indicators may be the most popular but Price must move before those indicators can create the line, which means Price and Time indicators lag. In the modern automated marketplace even a single day of lag can make a huge difference in profitability, especially with HFTs constantly searching for Dark Pool activity to spin big runs off of to make more money with Maker-Taker rebates from the exchanges.
Adding Quantity to an indicator formula is a relatively new concept, and has become essential when tracking Dark Pools and Professionals who start buying a stock before the downturn is completed. With their huge lot orders, their incremental controlled entry orders slowly overwhelm the selling, forming the bottom.
When these giants are buying in harmony V bottom formations develop with the Quantity, Price, and Time indicators giving an easy to recognize signal, which allows technical traders that earlier leading indication it is time to start preparing to move in. This increases the profitability of swing, day, intraday, and momentum trades.
See chart example below of Exxon Mobil Corp. (NYSE:XOM) for the Buy Zones of the Dark Pools.
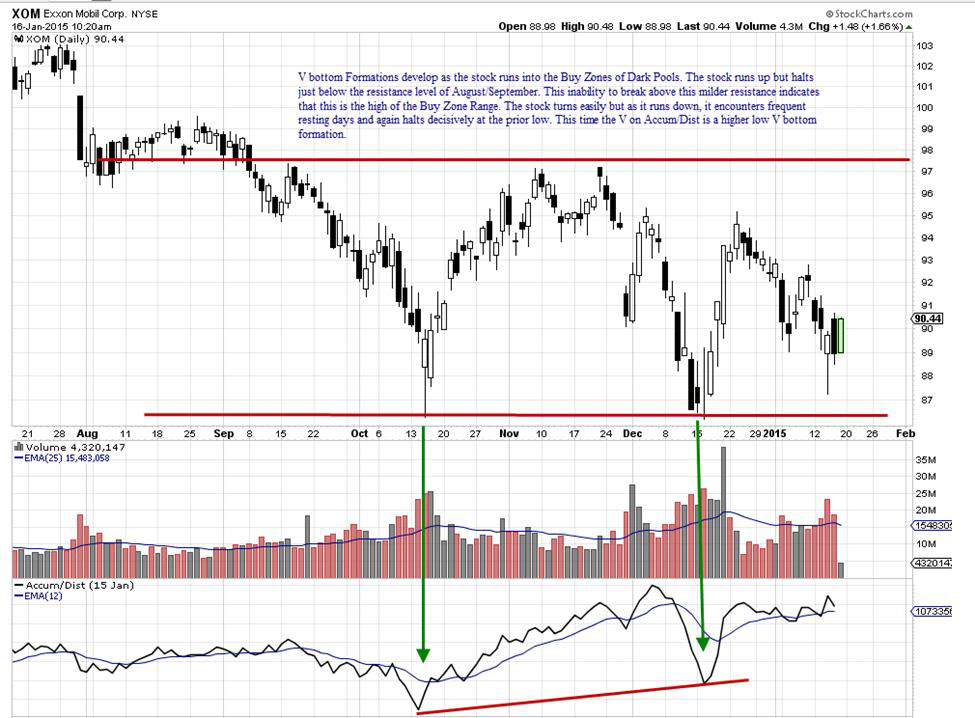
Dark Pools typically use a range of price for their Buy Zone, allowing the stock price to designate the entry point and the automated order halts as it nears the high of that range. The decisive low of price for the two V bottom formations clearly defines their entry low price. The higher V in December indicates that more Dark Pool orders triggered. HFTs chased them driving price up which caused the Dark Pool orders to stop. As the stock slips down once again, the next turn upward of price is a higher low.
Sell shorting technical traders need to be vigilant about watching for V bottoms. They are the beginning stages of a Shift of Sentiment™ pattern, which means that the power of the buyers aka the size of the share lots is overwhelming the sell shorters and sellers.
V bottom formations are an easy to read and interpret indicator pattern, but not every indicator has these patterns. It requires a more complex data set and more sophisticated formulation.
Summary:
For now there is not a true bottom, but if you studied the recent downside and calculated whipsaw action, technical traders would quickly realize that there was no viable sell short trade over the past couple of months.
Many technical traders chase news and rush into sell short a big blue chip stock, only to lose money on their trades. This occurs because they are unaware of who is controlling price, and where a “Shift of Sentiment” has started.
Trade Wisely,
Martha Stokes CMT
www.TechniTrader.com
info@technitrader.com