
Comparing Quantity, Volume, and MACD Indicators
One common dilemma for swing, momentum, or velocity trading is the whipsaw trade. Often the popular indicators such as MACD, Stochastic, Bollinger Bands® or other Price and Time indicators show a strong buy signal. Then after entering the stock, the technical trader watches the stock whipsaw against them resulting in a loss, or such a small gain that trading costs wipe out the meager profits.
Incorporating Volume based indicators and Hybrid leading indicators, helps to eliminate the whipsaw trade for most swing traders. These indicators are either line indicators or histograms.
By adding 2-3 Quantity and Volume indicators to their analysis, technical traders can quickly see the weakness of the trade and avoid buying into a whipsaw. Below are a series of chart examples of the same stock, which is United Healthgroup, Inc. (NYSE:UNH) over a period of several days.
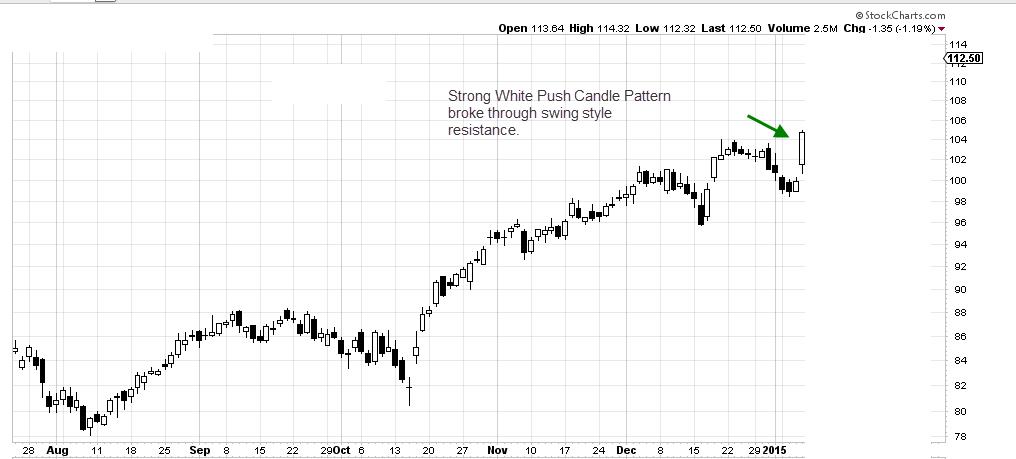
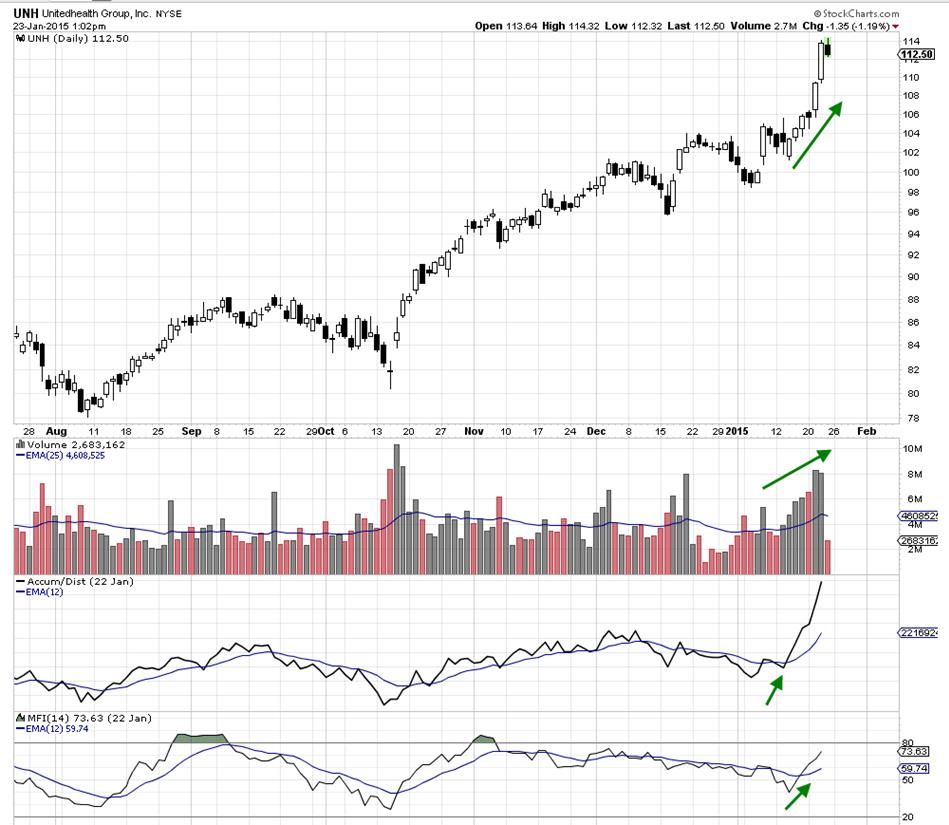
Chart example #1 price below shows a breakout strong White Push Candle Pattern has formed, pushing above the prior consolidation resistance level. This candlestick did not form on a High Frequency Traders HFTs volume spike, nor is it extraordinarily long for the historical price action of this chart.
Chart example #1 price
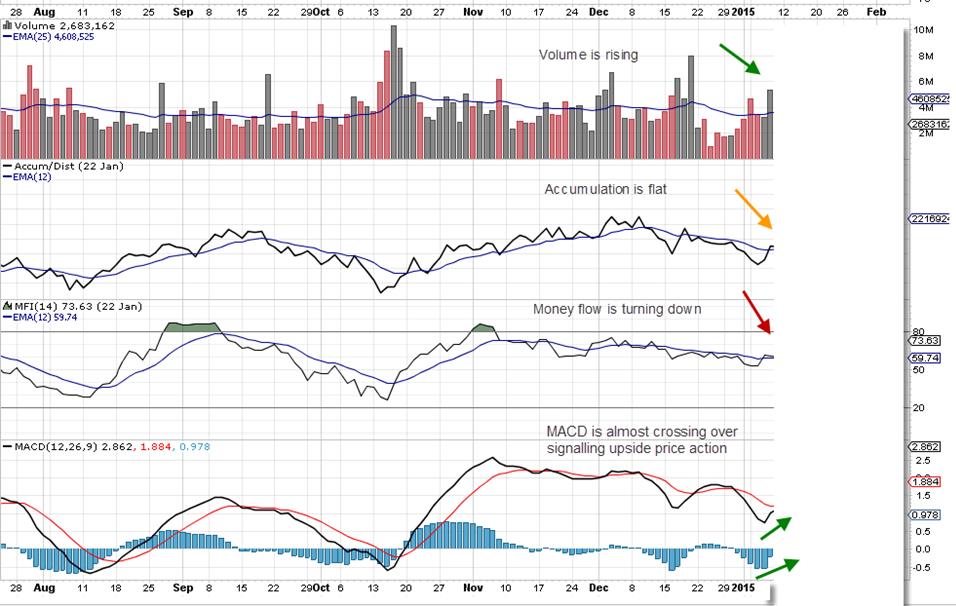
However chart example #1 indicators show Volume is rising, above average. Accum/Dist is flat indicating that large lot activity is not present. Money Flow Index MFI is turning down as the stock price moved up, indicating some rotation is occurring in the stock as price moves up. Rotation by Dark Pools is designed not to disturb the current price trend. The indicator MACD is almost crossing, which is often taken as an early entry.
Chart example #1 indicators
Technical traders often use limit orders hoping to increase their profits on a dip. Chart example #2 below shows the results of such a trade. The entry with a limit order puts the technical trader into a swing trade, as the stock encounters short term profit taking. While some Swing Traders may decide to hold, most tend to decide to sell at a loss OR their stop loss is so tight they are taken out. This is a common whipsaw trade that many beginning and novice technical traders encounter often.
Chart example #2
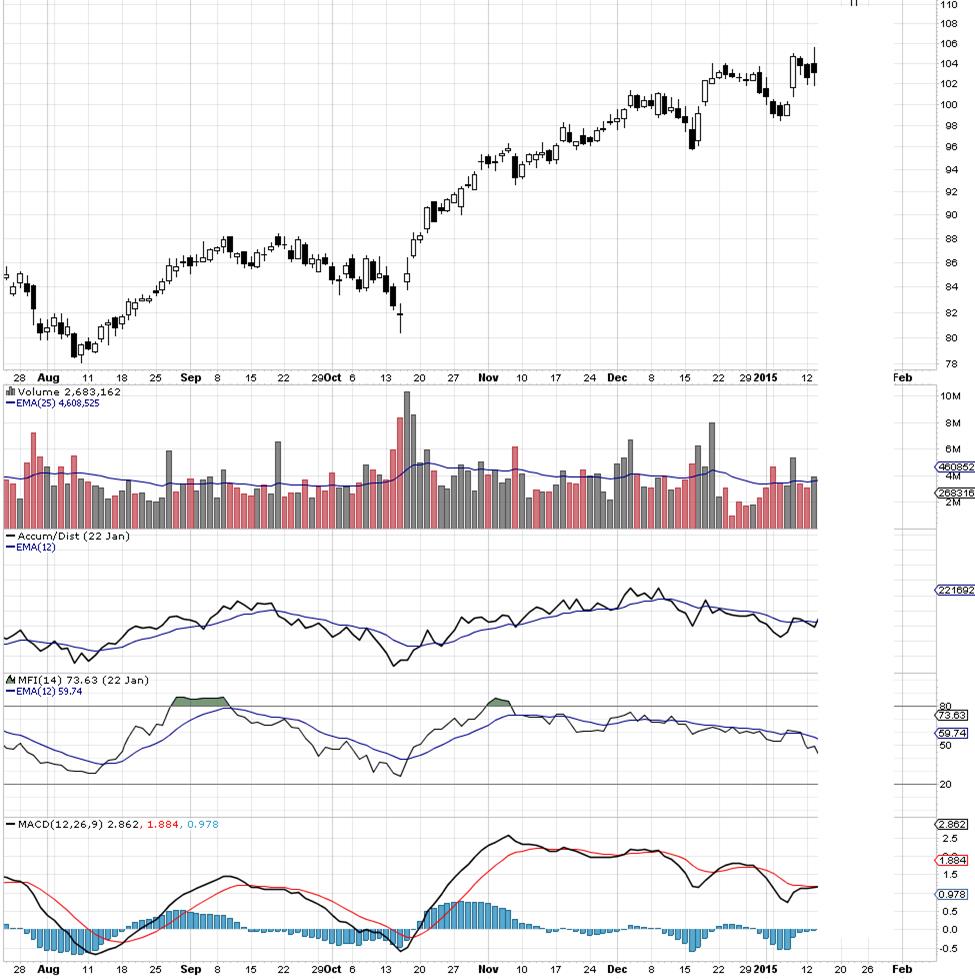
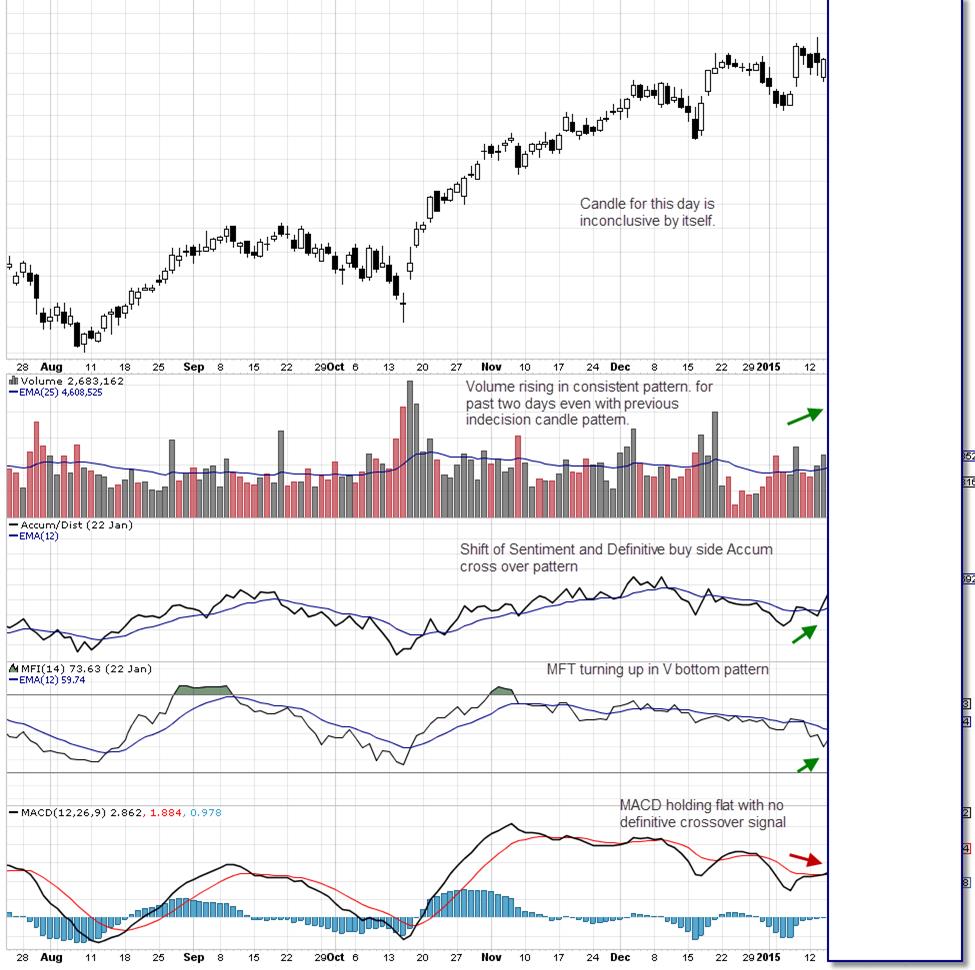
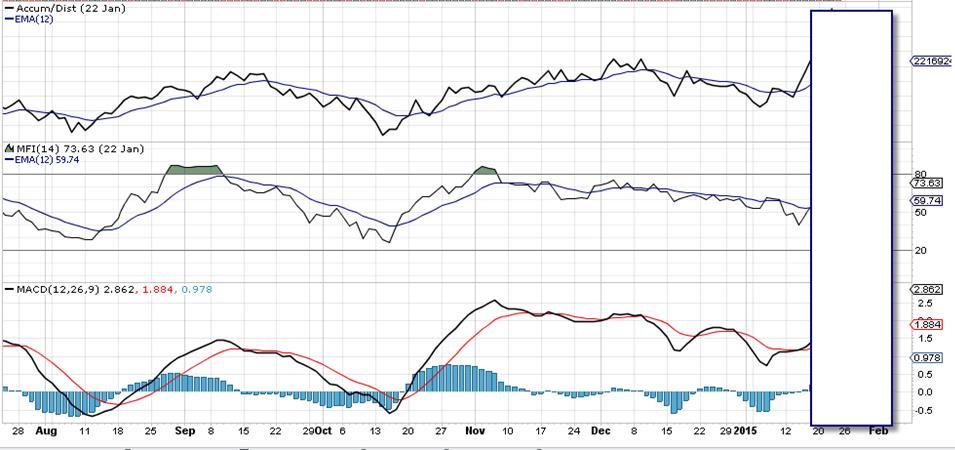
In chart example #3 below, the Accum/Dist indicator leads price but is moving faster upward than price or MACD, which remains flat along with price action that does not move up in the consolidation. MFI does turn. The Volume pattern becomes increasing consistently in last two days, which is a pattern indicative of large lot consistent incremental buying.
Chart example #3
In chart example #4 below are the results of the large lot buying, which is a sudden two day velocity run as High Frequency Traders HFTs discover the large lot activity. The spike on Accum/Dist warns of risk for profit taking on the last white candle.
Chart example #4
As shown in Indicator examples #5 below, Price must move up the next day before MACD catches up to Volume bars, Accum/Dist, and MFI. Exiting on the extreme spike pattern on Accum/Dist and MFI indicators with an FOD exit order maximizes profits, otherwise exiting after the profit taking has started decreases profits.
Indicators example #5
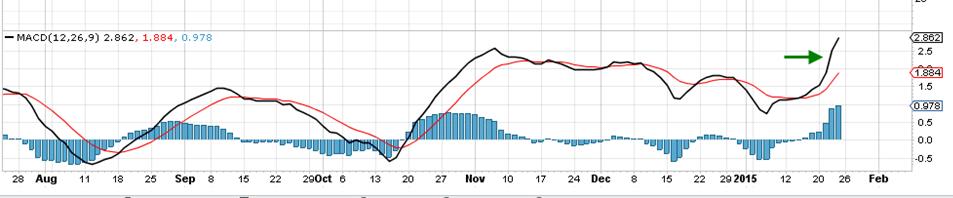
In addition MACD in Indicator example #6 below does not indicate or warn that the Price and Volume are extreme, the most important early warning signal that the stock is at risk of profit taking the next day.
Indicator example #6
Summary:
Technical Traders should use indicators that lead price. Adding Volume and large lot indicators provides information that is not always present in Price and Time indicators. When a giant of large lots starts to move into a stock, the orders are automated in such a way that the current price action is left undisturbed. A consolidation remains a consolidation as an example. However, recognizing the footprint of the large lots is revealed in the Volume and large lot Quantity indicators, before Price starts the velocity run fueled by HFTs.
Swing Traders need to learn how to interpret the subtler activity of the Dark Pools whose activity is often followed by HFTs, then enter before the HFT runs in order to net higher profits.
Trade Wisely,
Martha Stokes CMT
www.TechniTrader.com
info@technitrader.com