
Monitoring purposes SPX: Closed short SPX on 12/10/14 at 2026.14= gain 2.37%. Short SPX 12/5/14 at 2075.37.
Monitoring purposes GOLD: Gold ETF GLD long at 173.59 on 9/21/11
Long Term Trend monitor purposes: Flat
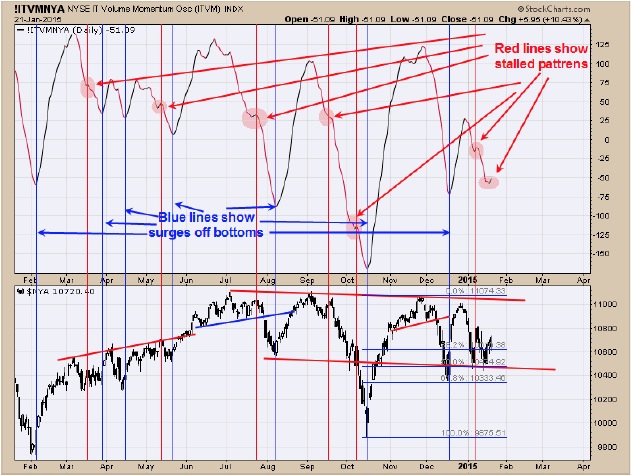
Above is the NYSE intermediate term volume momentum oscillator. We do think a market bottom is forming but is still incomplete. The chart above helps to illustrate that point. Previous hesitation in the Volume momentum oscillator proceeded more correction in the market. The tan colored circles help to point out though instances. If market continues higher tomorrow we may have to rethink our neutral position. I might add that today’s volume was near 10% lighter than yesterday’s volume on the SPY and ideally one would like to see volume to increase as market moves higher. The market has been up three days and the Volume Momentum Oscillator has barely budged. Previous good bottoms saw the Volume Momentum Oscillator surge. Still neutral for now.
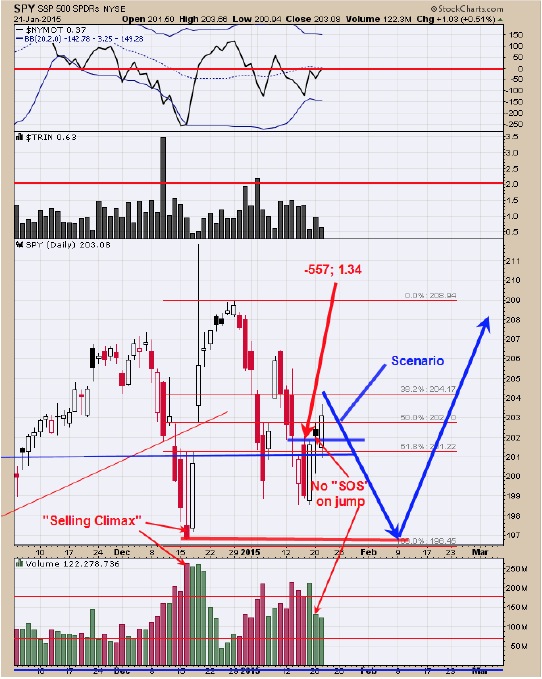
Today’s rally came on lighter volume than yesterday’s rally; showing rally is weakening. Yesterday’s jump above the previous three days came with out a “sign of Strength” (SOS) and suggests a false breakout. The low on January 15 came with a TRIN close of 1.34 and a Tick close of -557 and a bullish combination but at the minimum standard. Ideally one would have like to see a couple reading in this extreme to determine a low. A “Selling Climax” was recorded on December 16 and most “Selling Climaxs” are tested and we won’t be surprised if the December 16 low will be tested (near 197 on the SPY) and that will be the area where the buy signal is triggered.
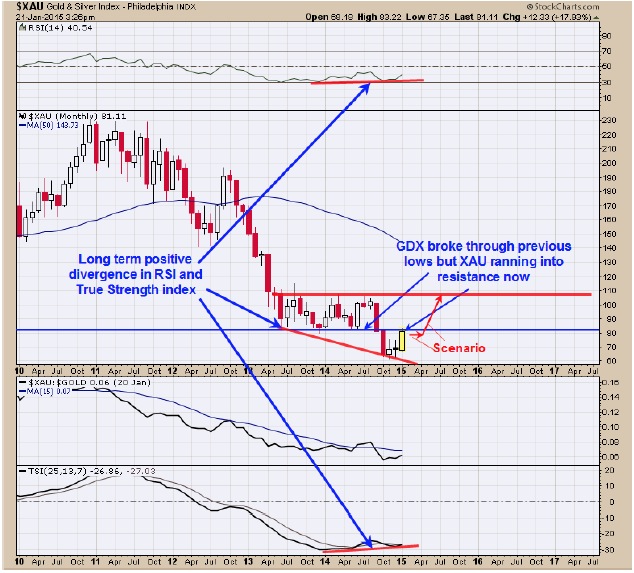
The longer term trend has turned up on gold stocks as the monthly charts are showing bullish divergences. Above chart is the monthly XAU. Both the monthly RSI (top window) and True Strength index (bottom window) are showing bullish divergences and suggests the current rally is not done. Notice that the XAU is running into the lows of 2013 that run into late 2014 near 81, which is a resistance area. We do expect the 81 levels will be exceeded at some point but may provide resistance short term. Ideally one would like to see the XAU to stay near the 81 resistance area on this potential consolidation as that would imply absorption of price and would be a bullish sign. Our scenario, market may take a short term rest with out backing away from 81 much than run to the next target near 110 range. We are long GDX on 1/6/15 at 20.47.
Tim Ord
Editor
www.ord-oracle.com/