
Earlier this month, in our March 2nd contribution, we set out to identify 16 ETFs for a winning strategy. Our investment horizon was the next few months, or until mid-year. During this exercise, we briefly considered SmallCaps, and especially IWM (the iShares Russell 2000 ETF). Yet, our Weekly relative strength chart of IWM vs SPY (the SPDR S&P500 ETF) was still heading down. Worse, its price targets were showing impulsive downside potential (red target projections on FinGraphs). Our strategy was to avoid such profiles, which were still clearly in a downtrend vs the market. Hence, at the time, IWM did not make the cut.
Given recent developments, we want to revise our judgement on SmallCaps today. We will first take a look at the relative strength chart of IWM vs SPY. We will consider a FinGraphs’ Investor’s View, a combination of a Weekly, Daily and Hourly chart. We believe it is now better positioned than it was a few weeks back.
IWM vs SPY – Investor’s View (a combination of a Weekly, Daily and Hourly chart):
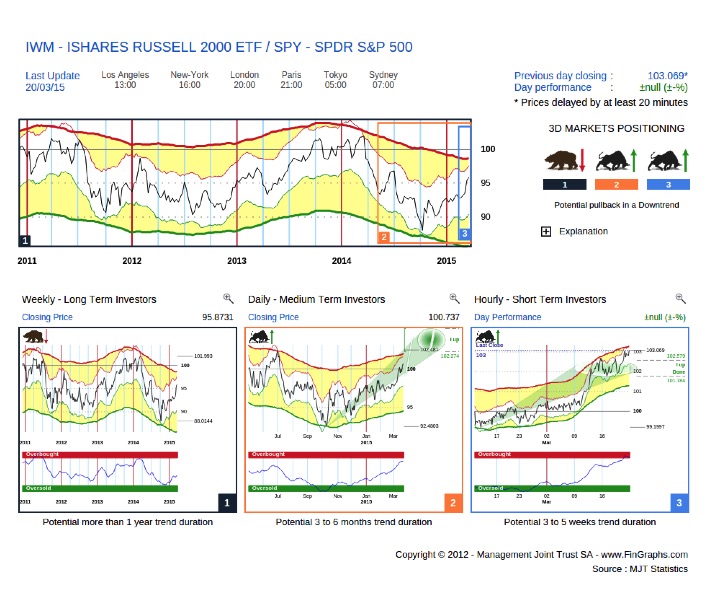
An Investor’s View is meant to give the perspective over the next few Quarters (Weekly left hand chart), over the next few months (Daily middle chart) and over the next few weeks (Hourly right hand chart). The Weekly chart on IWM vs SPY has now turned neutral: it is still in a Bear trend, but doesn’t show any targets anymore. This is often the sign of a trend, which is in the process of reversing, i.e. still in a Bear trend but with neutral targets (no targets). The Daily confirms this positive inclination. It is now in an impulsive uptrend, which means that it has moved above its corrective targets up and is now showing more upside potential over the next few months (green projected oval). Its Risk Index (lower panel) is not yet Overbought (below the red band) which confirms an advantageous risk/reward situation (more potential left / not yet Overbought). Finally, the Hourly has reached its impulsive targets up (“I up done”). This situation does point to some short term exhaustion, yet, it is still positive for now. Given the Daily, which, as we have just seen, is also positive, we would expect any consolidation to be only temporary.
So, to recap, the longer term situation on IWM vs SPY has turned neutral, the medium term is showing strong potential up and the short term, although a bit exhausted, is still heading up.
We believe there are yet more arguments to confirm our positive stance on IWM vs SPY:
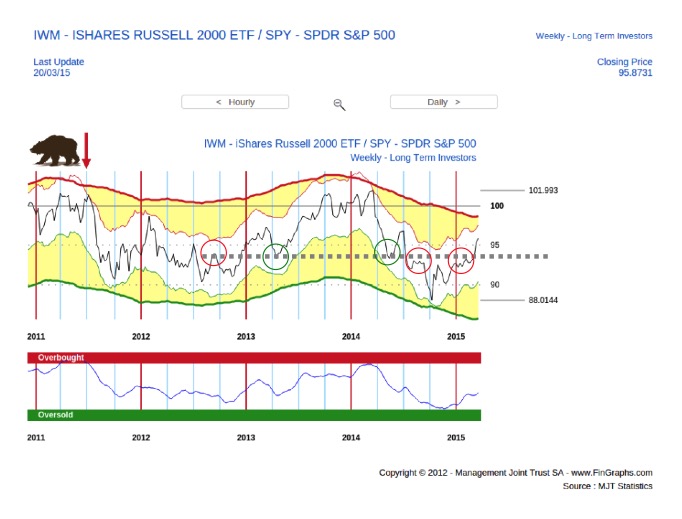
1. The upside breakout that we have just experienced on IWM vs SPY has broken important resistance levels. These have acted several times as support and resistance in the past:
IWM vs SPY: zoom on the Weekly chart:
IWM vs SPY: zoom on the Daily chart:
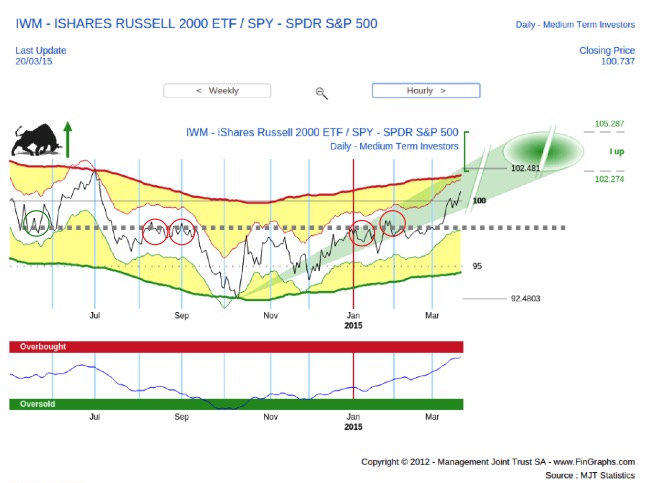
Making it above such important historical levels, which have been retested many times, does confirm the significance of the breakout.
2. The upside breakout in IWM vs SPY was achieved while SPY was correcting down. Indeed IWM has shown more resilience than SPY in the correction which recently took place (between end of February and mid March):
Side by side Hourly charts - IWM vs SPY and SPY alone:
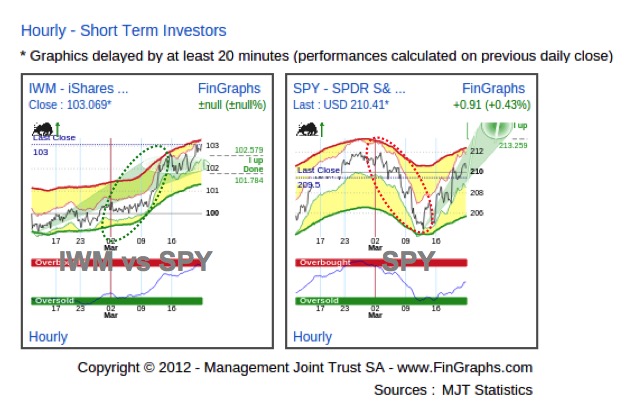
This situation is quite particular as SmallCaps are usually considered to be more pro cyclical than LargeCaps. Hence, when the general market stagnates, consolidates or corrects, they usually underperform. This wasn’t the case since early March and this anomaly can be traced back to concerns about the strength of the US Dollar. Indeed, a strong US Dollar can reduce the value of earnings generated abroad. It can also affect the competitiveness of US exporting industries. US SmallCaps, on average, are less internationally exposed that their larger cap counterparts. Hence, they are less affected by the rising US Dollar.
Going forward, we believe the US Dollar still has some potential up until mid-year. In our contribution last week, we also pointed out, that, in the meantime, a short term countertrend should take place. Following last week’s strong US Dollar correction down, the targets we had set for this countertrend have pretty much been achieved (4 to 5 figures up on EUR/USD, circa 3 figures down on the DXY Dollar Index). If we are correct, and the USD Dollar gradually resumes its uptrend from current levels, IWM may provide a nice domestic hedge to any US market weakness related to USD strength.
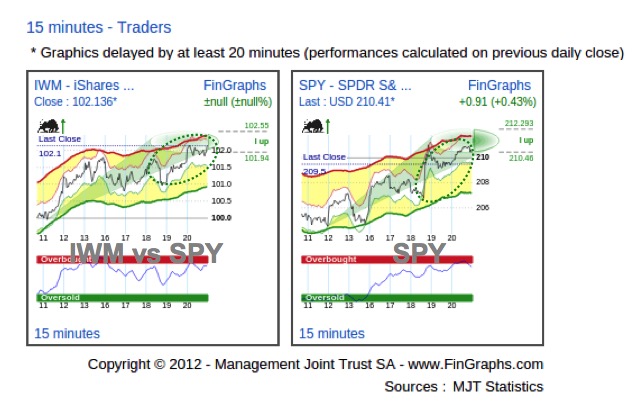
3. Last week’s price action provides evidence that IWM can also outperform when the market is rallying: last week’s USD correction and related market rally was accompanied by an outperformance of IWM vs SPY. SmallCaps seem to have retained their ability to also outperform in a pro-cyclical environment.
Side by side 15 minutes charts - IWM vs SPY and SPY alone:
We believe this relationship could provide further upside for SmallCaps vs the S&P500 going forward. Indeed, we are still Bullish on the market in general until mid year. We also believe the cyclical upturn could continue to accelerate. The Weekly Mosaic below presents SPY as well as IYC (the iShares US Consumer Services ETF) vs SPY. We will use this relative chart as a proxy for pro-cyclicality in the market.
Side by side Weekly charts - SPY alone and IYC vs SPY:
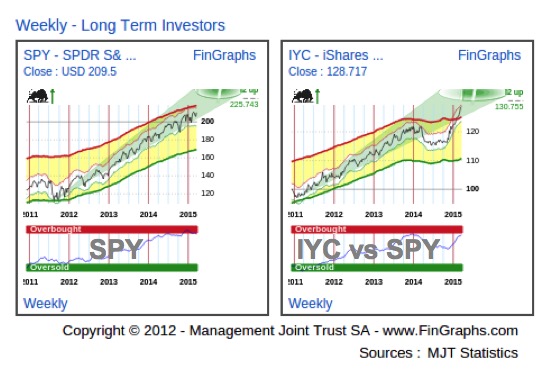
Both trends, although extended (“I2 up”, i.e. our extended Impulsive 2 targets), still show some potential over the next few months. So, SPY should continue up, cyclical stocks should continue to outperform and, along with them, SmallCaps (IWM) vs the S&P500 (SPY).
To conclude, following its important relative strength breakout, IWM should continue to outperform SPY over the next few months. It should provide pro-cyclical exposure and hence outperform when the market is up. Yet, if the market consolidates on the back of US Dollar strength, it could prove more resilient than the LargeCap space.
For more information on our methodology click here (http://www.fingraphs.com/#couponid-STKCHARTS14) and then view the Introduction slide-show and visit the ‘User Guide’ section on our website. Clicking that link also qualifies you for a 7 day demo and a 10% discount on our services if you choose to subscribe.
Have a great start to your week, J-F Owczarczak (@fingraphs)