
Monitoring purposes SPX; Flat.
Monitoring purposes Gold: Gold ETF GLD long at 173.59 on 9/21/11.
Long Term Trend monitor purposes: Flat
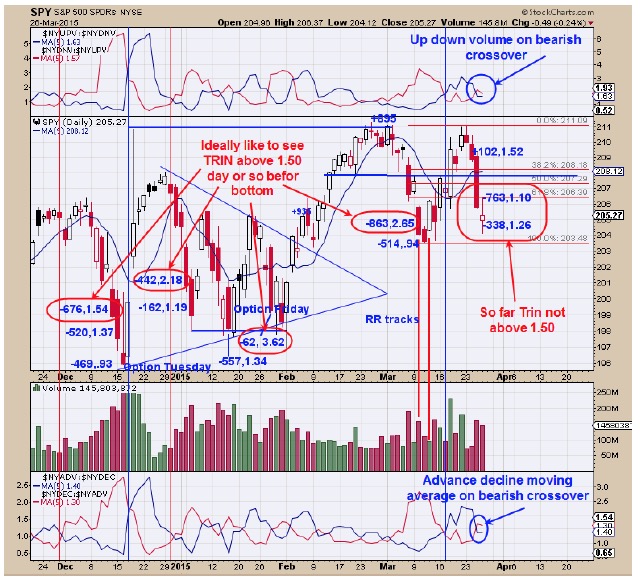
The top window is the NYSE up volume/Down volume with 5 period MA and NYSE down volume/Up volume with 5 period MA. These moving averages are on a bearish crossover. The bottom window is the NYSE Advance/NYSE decline with 5 period MA and NYSE Declining/NYSE Advancing with 5 period moving average and these to moving average are also on a bearish crossover. In the middle is the SPY chart with the relative closes for the TRIN and Ticks closes. Most short term bottoms form when the TRIN closes above 1.50 and ticks close below -300. The last two days the ticks have closed -763 and -338 respectively and in bullish levels. However the TRIN closes are 1.10 and 1.26 respectively and not in ideal levels where bottoms form. We would expect the TRIN to reach above 1.50 on the close before the next bottom is in. In our opinion the VIX also needs to go higher before a lasting bottom would be expected.
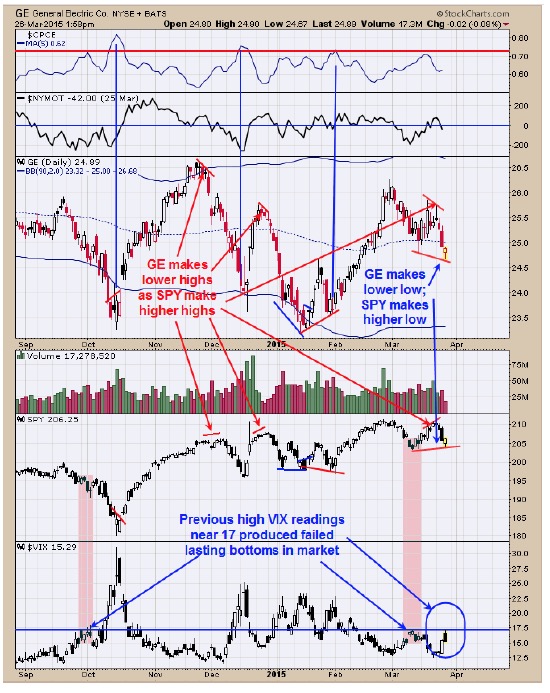
We have referred to this chart in past reports. It is said, “Where GE goes so goes the market”. We have pointed out with red arrows where GE made lower highs as SPY made higher highs and this negative divergence produced short term tops in the SPY. The recent top in the SPY saw GE made a lower high as SPY made a higher high. Notice that GE broke to a new short term low today and SPY made a higher low suggesting SPY has not found a bottom yet. The bottom window is the VIX. Worthwhile bottoms have formed in the SPY when the VIX reached above 22; which shows a lot of fear in the market. The failed low back in October 2014 and the recent market low on March 11 showed the VIX topping near 17 and both did not put in a lasting bottom. Market bottoms form on fear and panic and the VIX right now is not showing that Fear is high enough to form a lasting bottom in the market. The next worthwhile bottom in the market should see the VIX > 22.
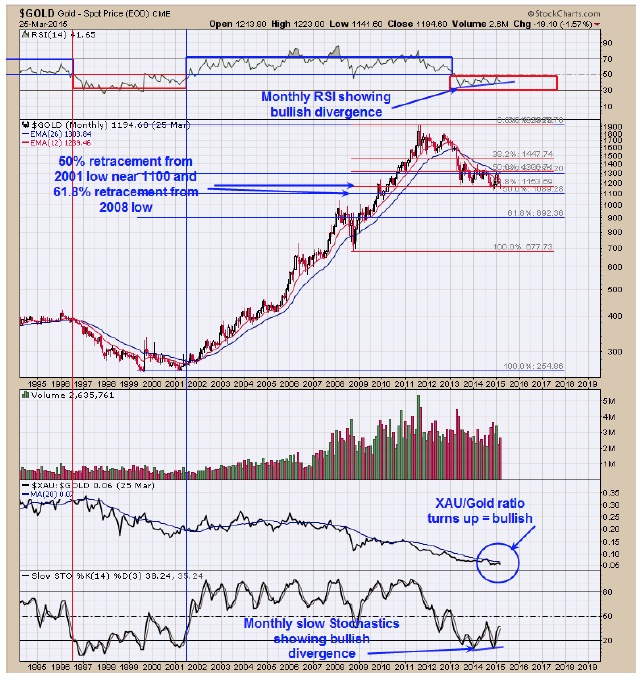
Above is the monthly gold chart going back to 1995. The top window is the monthly RSI for Gold which is making higher lows as Gold is made lower lows and a bullish divergence. The bottom window is the Slow Stochastics which is also has made higher lows as gold made lower lows and eventually will produce a bullish resolution for gold. A 50% retracement of the rally form the 2001 lows comes in near 1100 and a 61.8% retracement of the rally from the 2008 low comes in near 1150. With the bullish divergence on the monthly RSI and Slow stochastics a could form in the 1100 range on gold. A clue that at bottom is in on Gold will be for the monthly XAU/Gold ratio to turn up and close above it 20 period moving average. When the XAU/Gold ratio is trending higher it shows that gold stocks are outperforming gold and a bullish condition for both gold stocks and gold. There are major cycles for a low due in July and August period and may be where the next significant trades lines up.
Tim Ord
Editor
For examples in how "Ord-Volume" works, visit www.ord-oracle.com. New Book release "The Secret Science of Price and Volume" by Timothy Ord, buy on www.Amazon.com.