Rationales & Targets
How many times has Greece gone to the brink in the last year? Too many to count. And every time, Europe has blinked. The inevitable dénouement has been postponed so often that the market has been lulled into believing it will never happen, only delayed again and again. Well, today may prove quite different. There is simply no way Greece can maintain its place in the European Union, having mortgaged its future so ineptly over the last decade. When worst case scenarios are not adequately discounted, that is when they occur and when markets crater. We believe this particular worst case scenario has not even remotely been factored into pricing models and thus, the potential exists for a very sharp correction with virtually all of the world’s stock markets falling in concert.
The worst possible time this could happen is when leverage is excessive. Both the U.S. and China are at record levels of margin debt, leaving investors incredibly vulnerable to the downside, which would likely cascade into a free fall. At this juncture, we see nothing positive on the horizon that would change our expectation of a bear market taking prices near 20% lower. This week should prove pivotal. Again, the danger is on both sides of the trade, long and short, thus any new positions should be accompanied by close stops—certainly no more than 3%. In 51 years of observation, your Editor has never been more fearful than today. Watch SPX 2072 and Dow 17,698. Any lower, run for the nearest exit.
The Case For A 25% Decline
[A free three issue trial is available upon request]
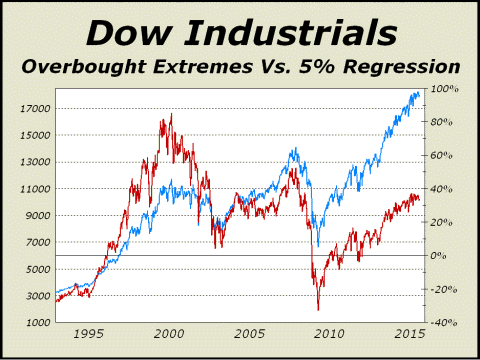
At least twice a year, we show a chart of the Dow Industrials dating back over a century accompanied by a 5% regression line. Our chart data goes back to 1890 and since then, the Dow has averaged annual gains of roughly 5% ex-dividends, thus we believe the line is a fair representation of normal expectations. Surprisingly, the Dow has been below the line 74% of the time. This seemingly weird circumstance simply mirrors what we know about markets. Bear markets tend to greatly overdo the downside and this factor tends to keep the Dow under the regression line longer than one might expect. Below left, we illustrate just how overbought stocks were in 2000 and 2007 by their percentage above the regression line.
There have been only four occasions in which the Dow has greatly exceeded the regression line on the upside. The first was during the Roaring Twenties, arguably the biggest mania of all time. As stocks peaked in 1929, our indicator soared to 86% above the line. The 1929 high was not exceeded until 1955 and the super bull market did not begin until August 1982, thus the Dow remained below the line for decades, finally rising above in 1996 as the tech mania approached. How amazing was the tech mania? Our indicator ran to almost exactly the same level as in 1929. The third peak arrived in July 2007, when both housing and stocks were in manic mode. And now, the present overbought condition has taken us almost 37% above the line. Bear in mind, this is only the fourth time we have seen this circumstance and each of the prior circumstances resulted in a horrific bear market. The dénouement need not be an exact replay of any of the cited prior bear markets. The Roaring Twenties resulted in an 89% decline in the Dow. Stock prices fell 50% from the tech mania peak and 50% again following the busted housing bubble. Although our present downside bear target is Dow 14,719, we would caution that a scenario in which prices briefly dip to the zero percent line on our chart at lower left would take us to under Dow 13,500, down roughly 25% from today. History shows us that a 25% decline occurs on average every 5.8 years. A bear market of this magnitude would actually be quite ordinary.

For more information, please contact us:
Alan M. Newman, Editor, Crosscurrents
516-557-7171
www.cross-currents.net
