Monitoring purposes SPX: Sold long SPX on 6/17/15 at 2100.44 = gain .77%.
Monitoring purposes GOLD: Flat
Long Term Trend monitor purposes: Flat

Timers Digest recorded the Ord Oracle #6 in performance for 6 months updated June 1, 2015.
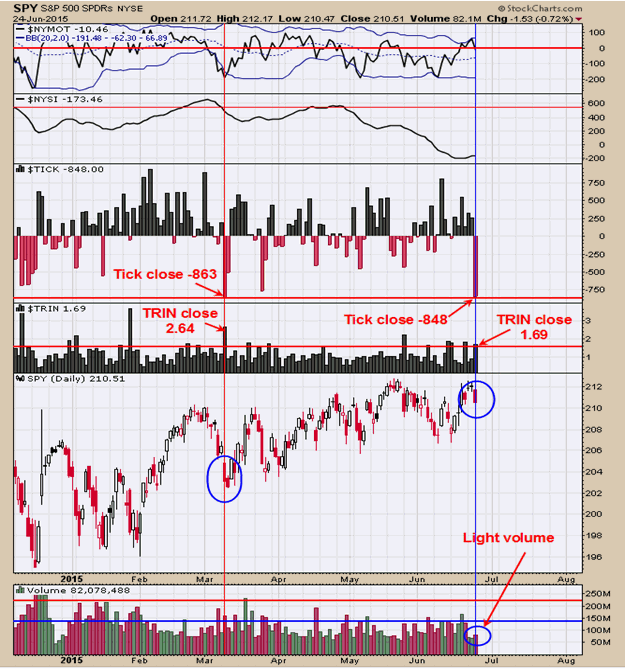
The tick closed today at -848 and the last time the tick closed this high came in March 10 with a reading of -863 and also had a TRIN close of 2.63; both showing panic readings. The March 10 period mark one day before a bottom. The TRIN closed today at 1.69 which shows panic and has increased importance with today’s panic tick close. This combination of panic TRIN and TICK close suggests a bottom is not far off. We would have liked large volume today to suggest a “Selling Climax” but that could show up before the week is out. Tomorrow and Friday’s statistics will be important to complete a potential buy signal. Flat for now.

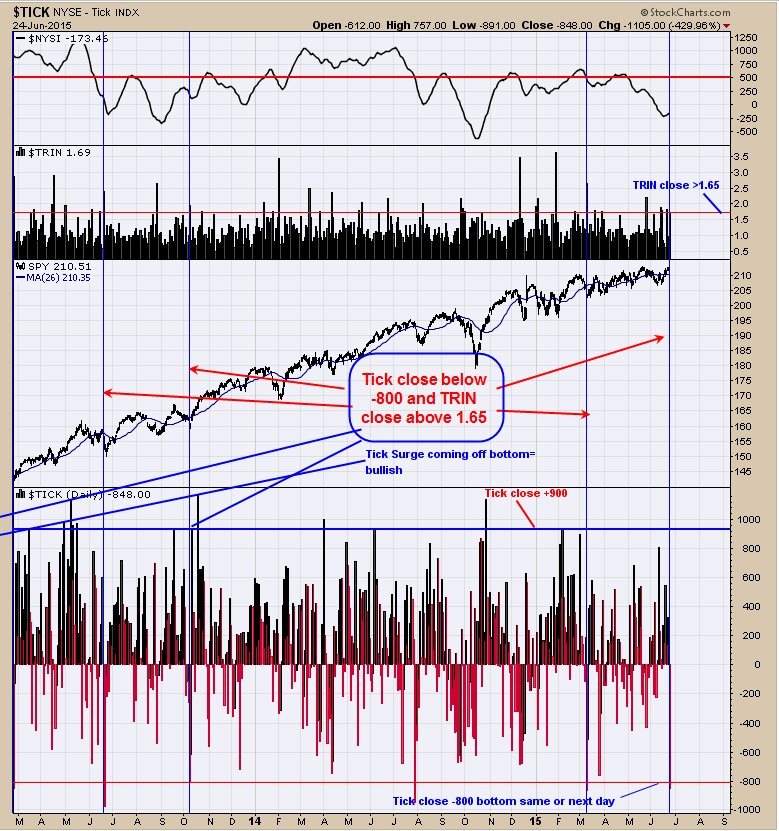
Above is an interesting chart that dates two year and four months. The chart shows when the TRIN closed above 1.65 and the Ticks closed below -800 the same day. Today’s Ticks closed at -848 and TRIN closed at 1.69. The three previous times these parameters where met the market was near a low. It’s fairly rare occurrence that the Ticks and TRIN readings met those parameters today. This time around could be different, but the Tick and TRIN readings suggests a low is near by.

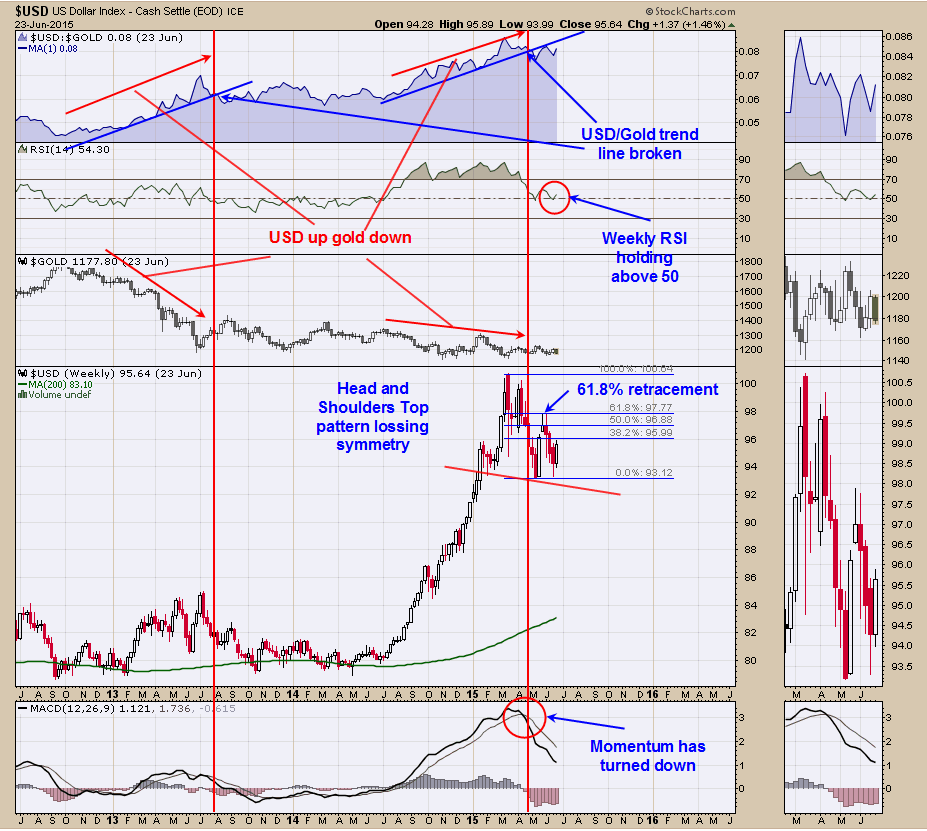
The chart above is the weekly US dollar (USD) going back to mid 2012. The top window is the USD/SPX ratio. When this ratio is rising than USD is outperforming Gold and when declining, than SPX is outperforming USD. In February of this year the uptrend line was broken and that Gold is now outperforming USD. To say that Gold has regained its footing and an uptrend may be starting is for the weekly RSI for USD fall below 50 and stay below 50 and as you can see on the chart it holding above 50; at least for now. We wrote earlier in the week that the USD may be drawing a Head and Shoulders top; and that may be still the case but with this weeks rally the symmetry is being lost and less chance for completion of this pattern. The bottom window is the MACD for USD which has turned down and a bullish sign for gold. USD uptrend appears to have ended at the February highs and from there, either the market has start a sideway move or a topping pattern. As pointed out on yesterday’s report, the monthly is also extended suggesting a topping pattern is in the making. We have cycle lows due in July or August for Gold and the USD is helping to support that ideal.
Tim Ord,
Editor
