
Monitoring purposes SPX: Sold long SPX on 7/16/15 at 2124.29= gain 1.05%. Long SPX on 6/25/15 at 2102.31.
Monitoring purposes GOLD: Flat
Long Term Trend monitor purposes: Flat
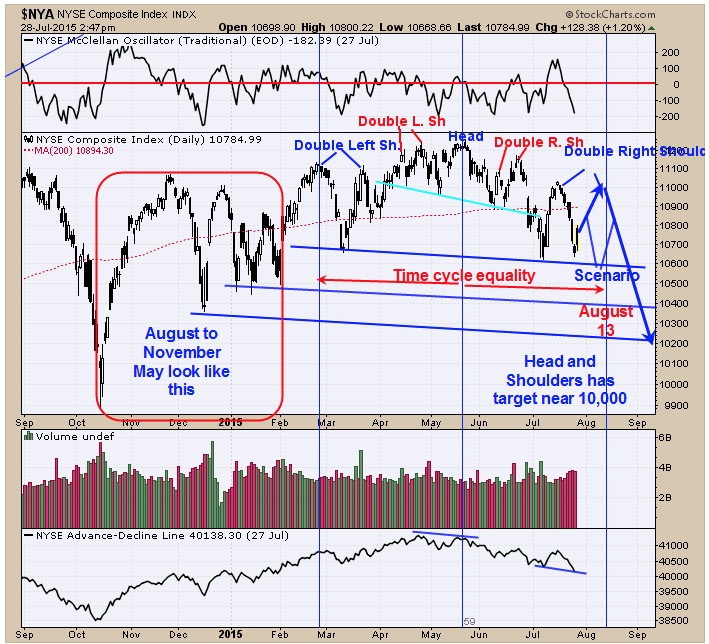
Chart above is the daily NYSE composite. As we said yesterday, the pattern forming appears to be a Head and Shoulders top where the May 21 high is the top of the “Head”. There appears to be two Head and Shoulder tops sharing the same “Head”. The larger of the two Head and Shoulders patterns is forming now and the “left Shoulder” of this pattern had two humps and the if the symmetry continues than the “Right Shoulder” should also have two humps. The first “Hump” formed at the July high and the Second “Hump” may be in progress now. We have drawn cycle lines from the first “Hump” to the “Head” and it equates to where the final “hump” may end which comes in August 13 and mark the time where the next decline may begin. The potential next decline may break the Neckline (near 10600 on the NYSE) and head to a downside Head and Shoulders measured target near 10,000. There are support levels before that coming in at 10,400 and 10,200 levels where market could bounce and we will deal with that when the times come. We put a border around the time frame from Mid October 2014 to February 2015. As we have said in the past markets have symmetry and if the current symmetry continues on the NYSE, than something similar looking to October 2014 to February 2015 may appear from August 2015 to November 2015. So the volatility could continue. We will keep on the lookout for the next high possible near the 11000 range on the NYSE. Sold long SPX on 7/16/15 at 2124.29= gain 1.05%.
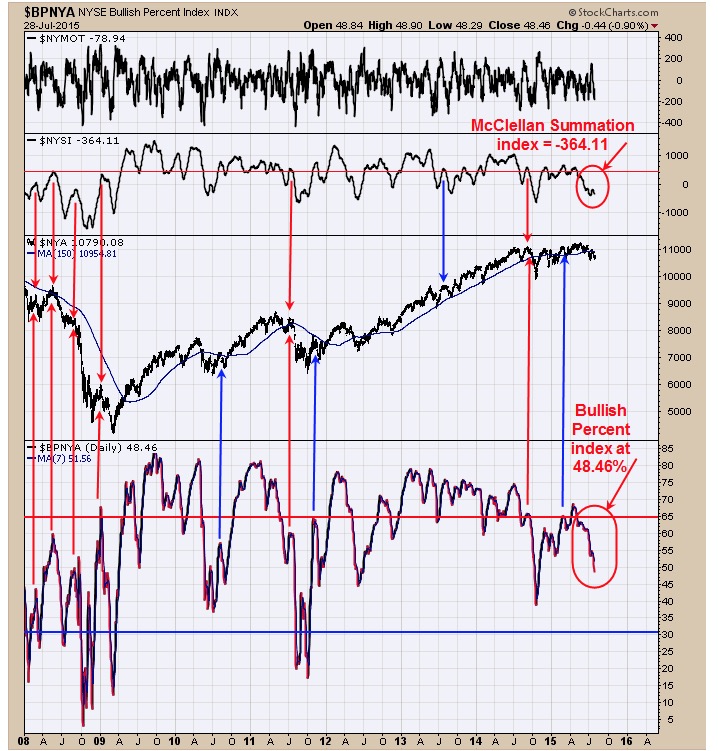
Market within a few percentage of the high and the McClellan Summation index stands at -364.11 and the Bullish percent index for the NYSE stands at 48.46% (48.46% of the stocks on the NYSE are on point and figure buy signals). Market internals have weaken considerable over the last couple of months but price wise have not eroded that much. The chart above is the daily NYSE with the Bullish Percent index in the bottom window and the second window down from the top is the NYSE McClellan Summation index. Strong decline can begin when the McClellan Summation index turns down before reaching +500 and near the same time the Bullish Percent index turns down before reaching +65%. The red arrows show when both indicators met these levels near the same time and the blue arrows shown when one indicator turning down below the bearish level but not the other. As you can see both the McClellan Oscillator and Bullish percent index are in the bearish levels suggests the next decline could be large. Still neutral for now.
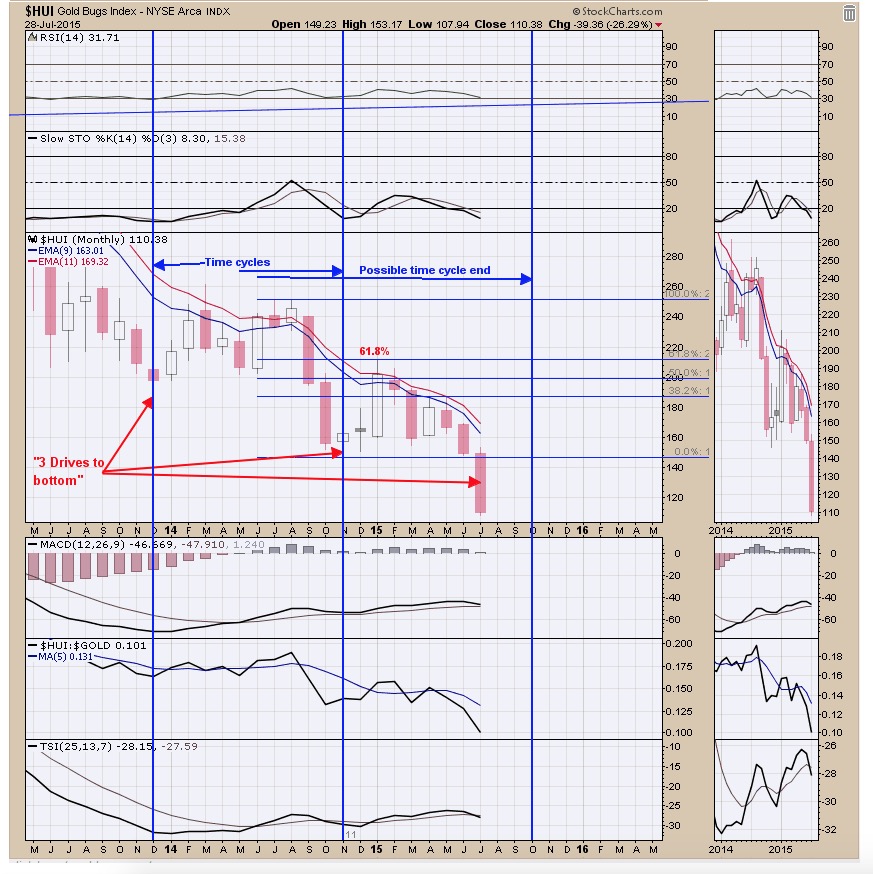
Little change in the gold market today and nothing new to add to yesterdays’ report. We did update the chart from yesterday and now we wait. A close above the 9 and 11 monthly moving average will turn the trend back to bullish, which would require a close above 160 range on the HUI. Yesterday we said, “Gold and Gold stocks appear to be heading to a bottom. We have displayed the monthly HUI chart above on previous reports and the bullish divergences are still present. The monthly RSI is still showing a modest divergence and still remains bullish. The monthly Slow stochastics retains its bullish divergences as well as the MACD and True Strength index. The pattern forming still has the resemblance of a “Three Drives to a bottom” where off the second bottom the market retraced 61.8% of the previous decline. The latest Commitment of traders report show the Small Speculator (dumb money) short 6695 contracts and the shortest position held since the last low in the gold market of November 2014. The Commercials (smart money) have the least short position since last November also coming in at 21,584 short contacts. In general when the Commercials are short less than 50,000 contracts it usually a bullish sign for gold. It looks as though the equity market is nearing a top and the gold market is nearing a bottom about the same time. If the money comes out of the equity market it may go to the gold market. Still neutral for now.”
Tim Ord,
Editor
For examples in how "Ord-Volume" works, visit www.ord-oracle.com. New Book release "The Secret Science of Price and Volume" by Timothy Ord, buy on www.Amazon.com.