
Monitoring purposes SPX: neutral.
Monitoring purposes GOLD: Long GDX on 5/31/16 at 22.58; stop 21.41.
Long Term Trend monitor purposes: Short SPX on 1/13/16 at 1890.28
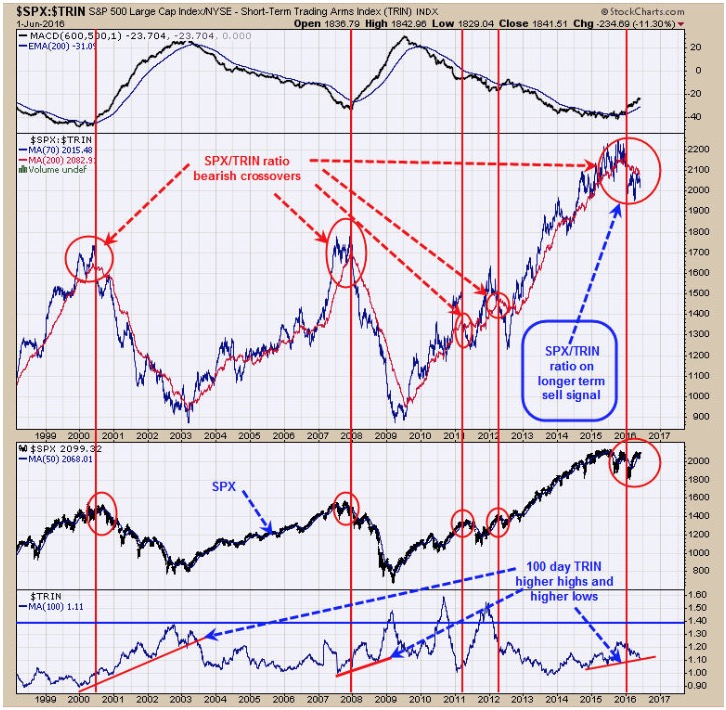
The chart above has a longer term view of the SPX. In general when the TRIN is above 1.00 than that is considered a bearish day for the market and when TRIN is below 1.00 than that is considered a bullish day for the market. The 200 and 70 day moving averages of the SPX/TRIN ratio helps to find the longer term bullish and bearish trends. The middle window is the 200 and 70 day moving average of the SPX/TRIN ratio. The red vertical lines show when the 70 day MA passes down through the 200 day MA and a sell signal. As you can see it has been correct in all instances, one early one late and two spot on. The current sell signal has been a little late and remains on a sell signal even through the rally from the February low. The bottom window is the 100 day TRIN. It’s a bearish condition for the market when the 100 day TRIN is making higher highs and higher lows, of which is what happening now. When the 100 day TRIN gets above 1.40, the market is heading into a major low. The top window is the MACD of the SPX/TRIN ratio and when it rising is a bearish sign.
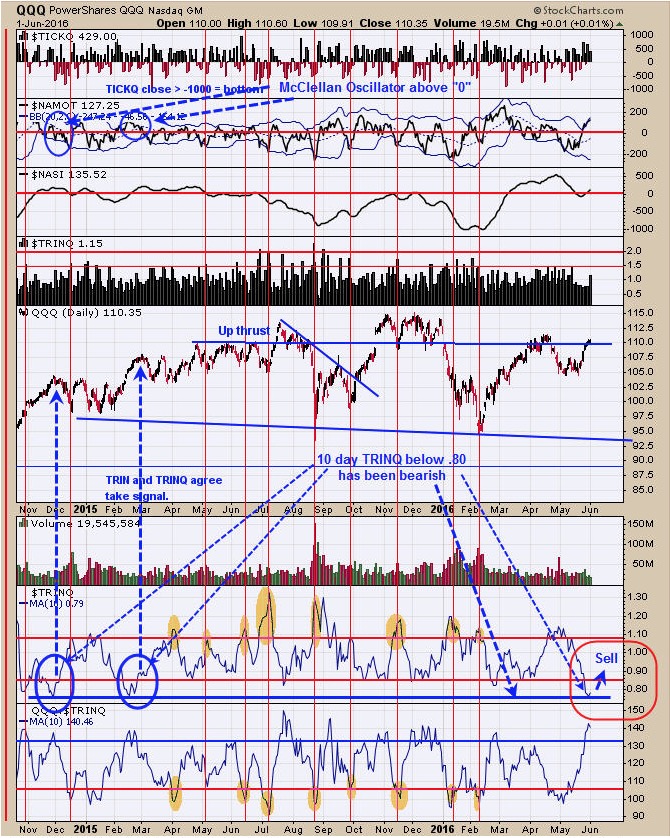
The reason we said the upside appears limited for the SPY is this chart of the QQQ. The second window up form the bottom is the 10 day average of the TRINQ. It rare for the 10 day TRINQ to get below .80 and the previous two examples has lead to decent pull backs. The signal actual comes when the 10 day TRINQ closes back above .85 and in the previous two case took several more days. Still expecting limited upside for short term and If the QQQ has limited upside, than so should the SPY.
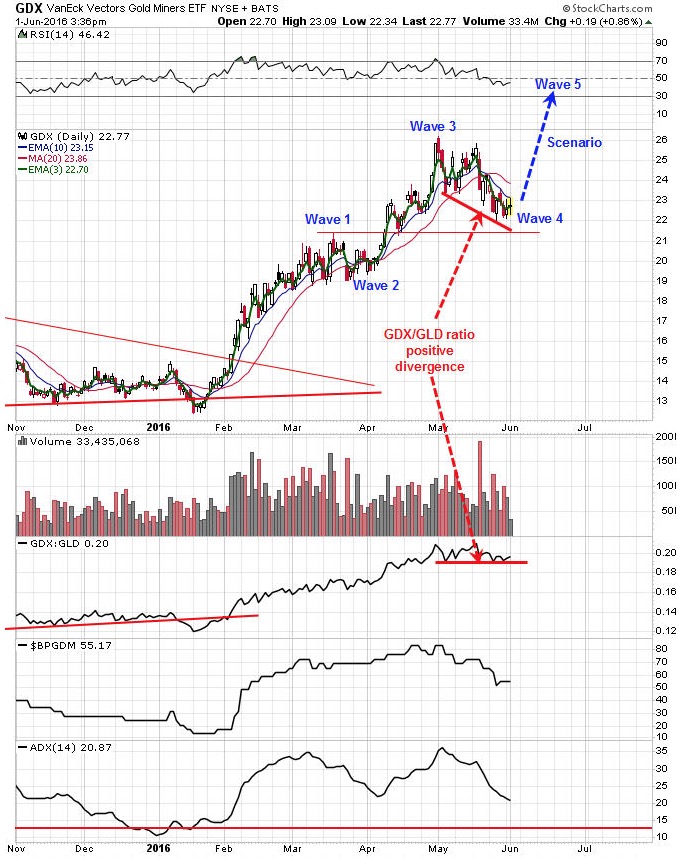
Above is the daily chart for GDX. On Yesterday’s report we mentioned the possible developing Elliott Wave five count up but didn’t show the chart, well the chart above does look at the Elliott Wave count. In bull markets Elliott unfolds into a five wave count up and in bear markets only three wave are counted. With the monthly RSI for the XAU surpassing 50 (suggesting a bull market has started for the gold stocks) than an Elliott Wave five count up should be expected and so far we only count four waves. For Elliott Wave to confirm the bullish case than Wave four may be ending now and Wave five up to new highs would be expected. To negate this bullish scenario would be for Wave four to touch the previous high of Wave one (which is not to suppose to happen in Elliott wave five count up) which is 21.42 and the reason we have a stop at 21.41. Long GDX at 22.58 stop at 21.41.
Tim Ord,
Editor
For examples in how "Ord-Volume" works, visit www.ord-oracle.com. New Book release "The Secret Science of Price and Volume" by Timothy Ord, buy on www.Amazon.com.