
SPX Monitoring purposes; Short SPX on 8/30/17 at 2457.59.
Monitoring purposes GOLD: Sold 10/10/17 GDX at 23.57= gain 2.34%; Long GDX on 10/2/17 at 23.05
Long Term Trend monitor purposes: Neutral.
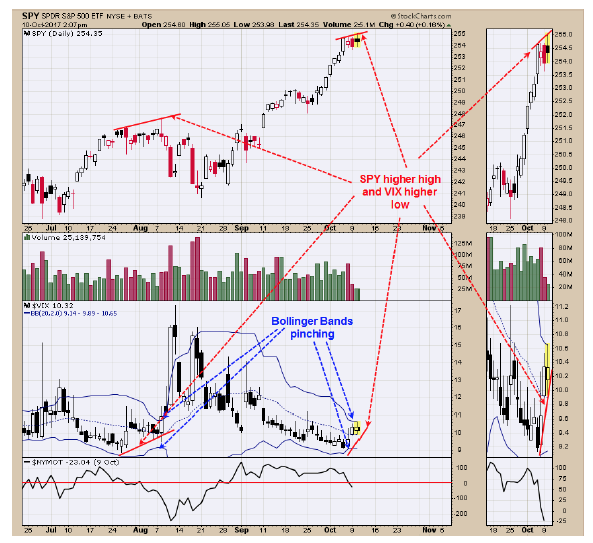 In general the VIX trades opposite the SPY and when there is a divergence between the two a direction change in the SPY is possible. Today the SPY hit a new short term high and to keep the “Rhyme” of the market going, VIX should have hit a new short term low. Instead the VIX made a higher low and produced a divergence, which is a similar divergence that appeared at the August high. Also notice that the VIX Bollinger bands are “Pinching” which also “Pinched” at the August high. . October has been down with years ending in 7 going back to 1907 and the SPY closed at 251.29 on the first trading day of the month suggesting SPY will be lower than that on the last trading day of the month. Short SPX on 8/30/17 at 2457.59.
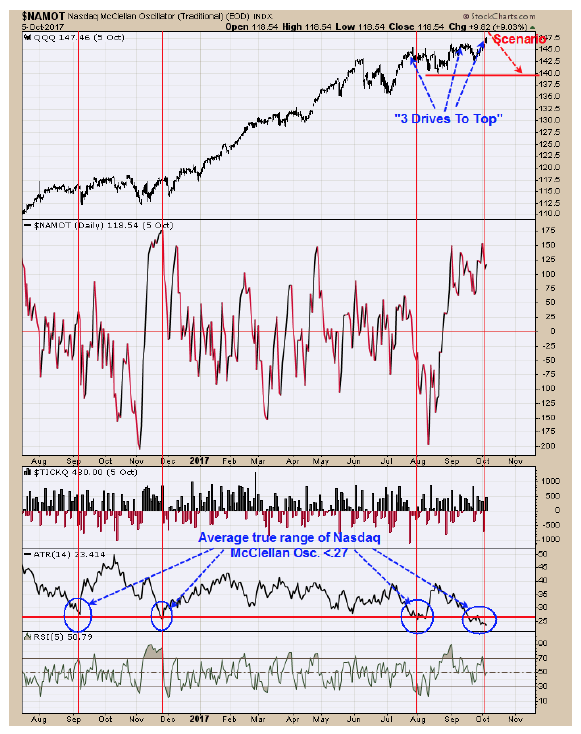 The second window up from the bottom is the “Average True range” (ATR) of the Nasdaq McClellan oscillator. Normally when ATR of the McClellan Oscillator reaches below 27 the market is near a short term high (identified with red vertical lines). Current reading is 23.414. We showed the ATR of the NYSE McClellan Oscillator reading yesterday and it rhymes with the ATR of the Nasdaq McClellan Oscillator reading. We also pointed out yesterday that the QQQ could be drawing a “Three Drives to Top” which has a minimum downside target near 137 which would equate to 2424 on the SPX. The uptrend appears near an end. Short SPX on 8/30/17 at 2457.59.
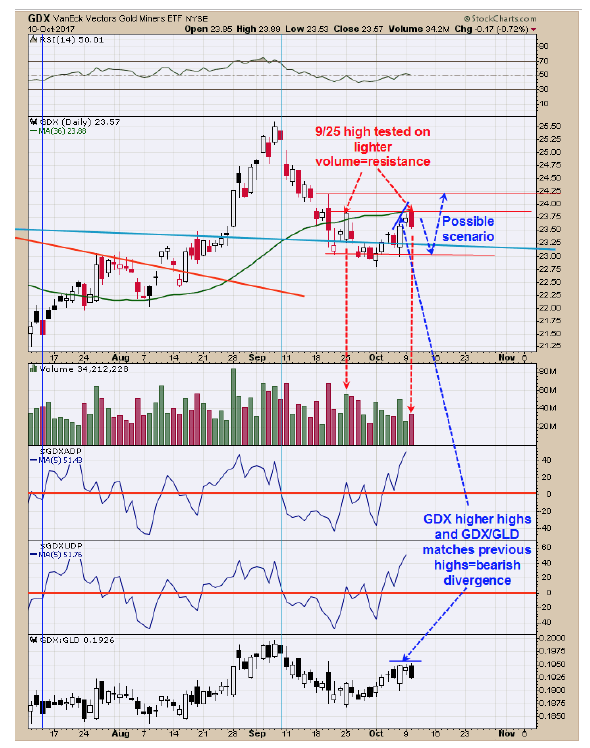 Yesterday we said, “The bottom window is the GDX/GLD ratio which closed below its previous high as GDX closed about its previous high and a bearish divergence. If this bearish divergence carries on it could stall the GDX rise. We have two possible upside targets which are the September 25 high which is 23.87 (all most there) and the September 20 high of 24.20 which was a high volume day and most high volume days high are tested at some point. If the September 20 high volume day’s high is tested on light volume would suggest resistance and a short term bearish sign.” Today GDX tested the September 25 high on lighter volume and back away and GDX/GLD ratio matched its previous high while GDX made higher high both of which are divergences. A possible area of support will be the October 6 low of 23.00. This scenario may change and condition change in the market. Sold long GDX on 10/10/17 at 23.57=gain of 2.34%. Long GDX on 10/2/17 at 23.05.
-Tim Ord
http://www.ord-oracle.com/
New Book release "The Secret Science of Price and Volume" by Timothy Ord, buy on www.Amazon.com.