
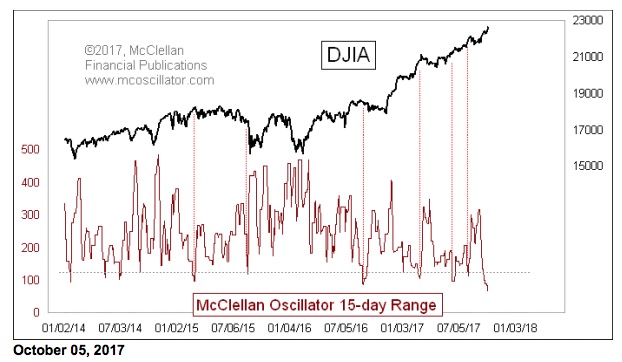
Back in June, I introduced you to the indicator in this week’s chart, which examines how much movement the McClellan Oscillator has had over the preceding 15 trading days. My timing was excellent, in that I so precisely picked the one time that a really low reading did not seem to matter at all.
Most of the very low readings for this indicator mark meaningful tops for stock prices. It was just my luck that I called attention to it just at the moment when a wonderful exception appeared.
Now we have another very low reading, the lowest in 16 years to be specific. We have not had a reading this low since 2001. This makes an uncommon statement about how calm and orderly the market is at the moment. Calmness cannot persist, and orderliness tends to yield to chaotic action.
I should further clarify that this is looking at a range over 3 weeks. Years ago, some analysts used to believe that seeing a very minor change in the McClellan Oscillator from one day to the next was a sign that a “big move” was coming. I debunked that here: The Meaning of Minor McClellan Oscillator Changes.
What this 15-day range indicator is showing is the tight range of readings that have been presented over the past 3 weeks. We can see that more directly in this chart of the McClellan Oscillator, which is featured every day on our web site.
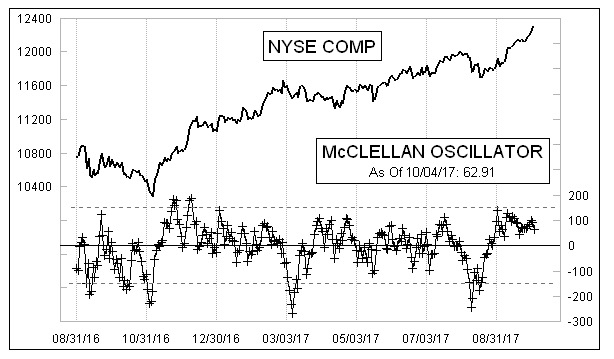
All of the readings since Aug. 24 have been above zero. And all of the readings since Aug. 30 have fallen between +34 and +137. That is a pretty tight range. A long study of past readings shows that looking back over just the prior 15 trading days makes for a good indicator, showing that the stock market has become excessively calm and quiet, befitting a meaningful top. Now all we need is for the stock market to behave itself this time, and show us a proper top indication.
Tom McClellan
The McClellan Market Report
www.mcoscillator.com