
SPX Monitoring purposes; long SPX 10/16/17 at 2557.64.
Monitoring purposes GOLD: Covered short GDX at 23.23 on 10/20/17 =gain 2.56%; Short GDX on 10/13/17 at 23.84.
Long Term Trend monitor purposes: Neutral.
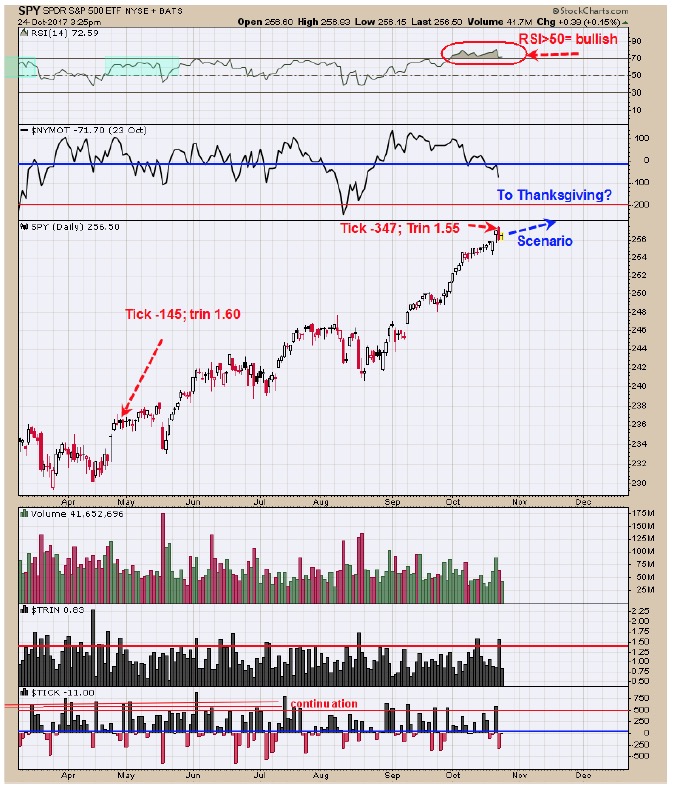 Yesterday the Tick closed at -347 and the TRIN at 1.56 which is a bullish combination. The last time the market was near a high and the Tick and Trin closed near the current levels came on April 27, 2017 and the market staggered higher for another three weeks. It common for the market to produce high or lows around holiday’s and the next holiday is Thanksgiving November 23 which is about four weeks away and could be the time where market could take a rest. Long SPX on 10/6/17 at 2557.64.
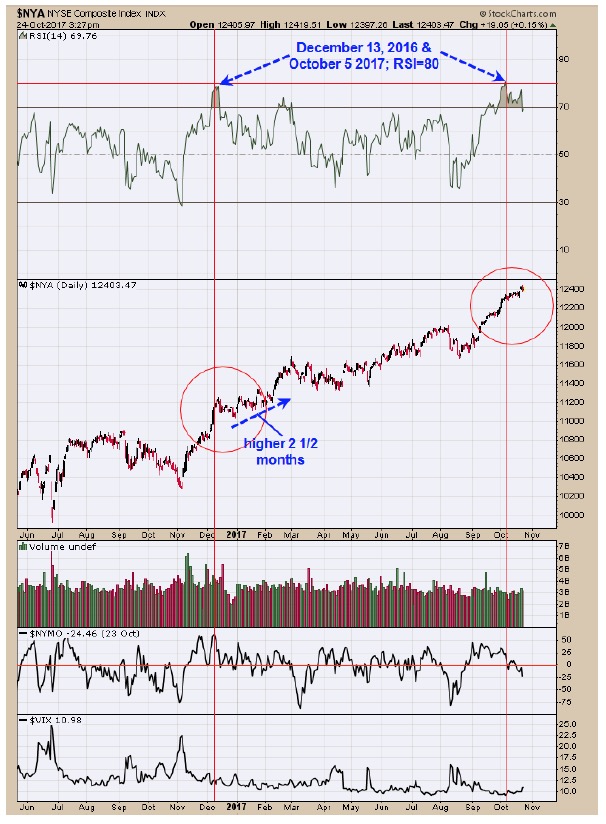 Above is the NYSE chart going back to mid 2016’s and shows the last time (time before the RSI reached 80 on 10-5-17) when the RSI reached 80 which was December 13, 2016. The December 13 RSI reading of 80 did slow the advance but in general market still moved higher into March, two and half months later. We did studies going back to 1990’s and when the RSI reached 80 markets stalled in some cases but was never (never say never when market is in same sentence) a worthwhile top. In most case the market staggered higher for at least six weeks and some cases, much longer. Markets weaken before they reverse and so far the only minor weakness was seen yesterday. If market is making a top here, it will test and retest the recent high. There where several tops formed about six weeks later after an RSI reading reaching 80 and that would put a top around Thanksgiving time. Its also common that tops and bottoms form around holiday’s making Thanksgiving an important timeframe.
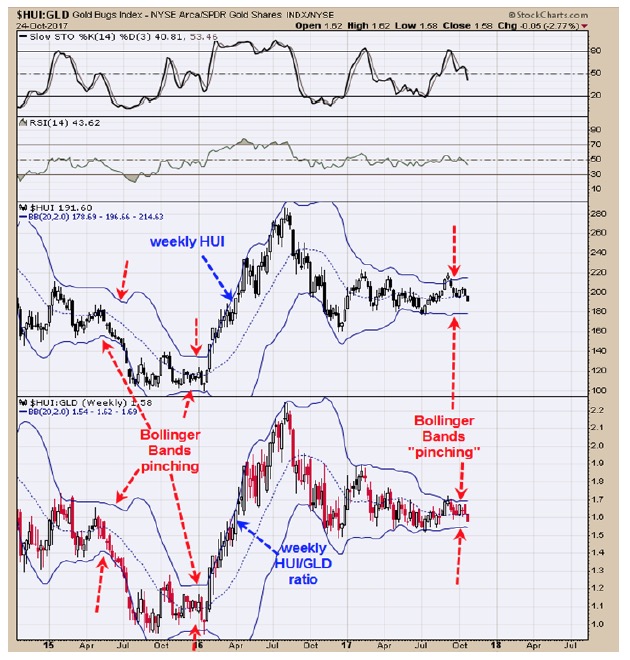 Above is the weekly HUI and HUI/GLD ratio. We have identified with red arrows the times when the Bollinger Bands are pinching. The Pinching of the Bollinger bands suggests a large move is nearing. The Bollinger Bands pinched back in April 2015 right when the HUI and HUI/GLD ratio where breaking down and again in December 2016 when both HUI and HUI/GLD made a large move higher. The current pinching of the Bollinger bands is at the narrowest and suggests the move will be as big or bigger than the last two pinches. The pinching of the Bollinger bands does not give the direction of the break, only that a break is coming. Our view is that HUI could work to the lower Bollinger band into December and find support near 180, but we don’t have a clear signal at the moment for that trade. The Commercials (Smart money) short 222K contracts which is bearish for gold. For very short term the indicators are mixed and we will wait for the next setup. Covered short GDX on 10/20/17 at 23.23 = gain 2.56%; Short GDX 10/13/17 at 23.84.
Tim Ord,
Editor
Visit www.ord-oracle.com. New Book release "The Secret Science of Price and Volume" by Timothy Ord, buy on www.Amazon.com.