 October 27, 2017
When we talk about “the McClellan Oscillator”, we usually mean the indicator calculated on the Advance-Decline (A-D) numbers from the NYSE. But a McClellan Oscillator can be calculated on any sort of breadth data. And when the same math is used on closing prices, we call that a McClellan Price Oscillator.
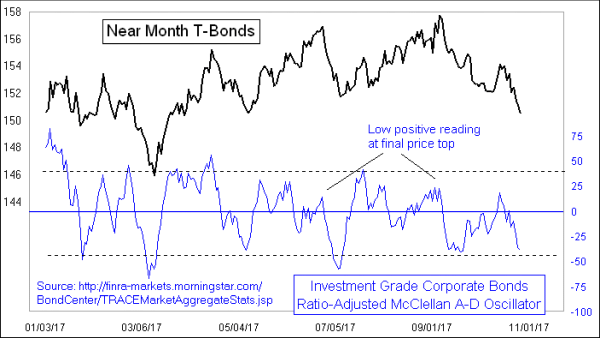
The chart this week shows a McClellan Oscillator calculated on investment grade corporate bond A-D data. Those data are published each day by FINRA, and they correlate very closely with the movements of Treasury bond prices. Like the NYSE version, negative readings show a downtrend and positive ones show an uptrend. Overly extended readings show likely end points for such trends.
This week we see this indicator getting down close to an oversold reading. Sometimes a reading like this is enough to mark a price bottom for T-Bonds. Other times prices can continue going lower in spite of such a reading. Getting down to a reading well below -40 is a surer indication of an exhaustion event, and this one is not quite there yet. This sort of reading says that the bond market is a little bit oversold, which could be enough for a bottom. But it is not yet far enough oversold to guarantee one.
Tom McClellan
Editor, The McClellan Market Report
