
SPX Monitoring purposes; Long SPX on 6/29/18 at 2718.37.
Monitoring purposes GOLD: Long GDX on 7/6/18 at 22.61
Long Term Trend SPX monitor purposes: Long SPX on 6/29/18 at 2718.37
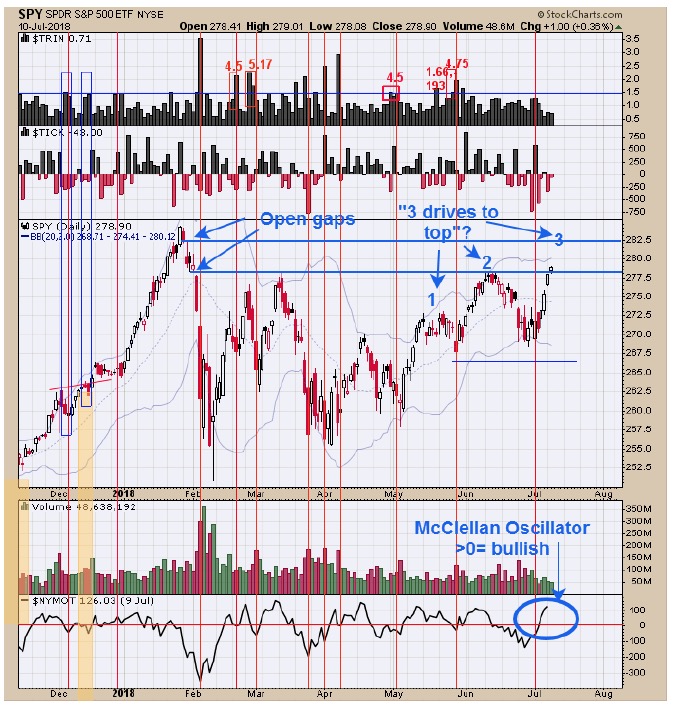
SPY appears to be breaking above the February, March and June highs and heading for the gap levels that formed back in January. The first half of July is bullish seasonality wise and market can push higher short term. We are looking for signs that market may stall short term but we don’t have evidence to step out of our position. A pattern that could be forming here is a “Three Drives to Top” and market is working on the third top now. This pattern would have a downside target near 267.5 range on SPY. The worst performing months of the year are August and September so most likely another top may form in the coming weeks after the next high is in place. Long SPX on 6/29/18 at 2718.67.
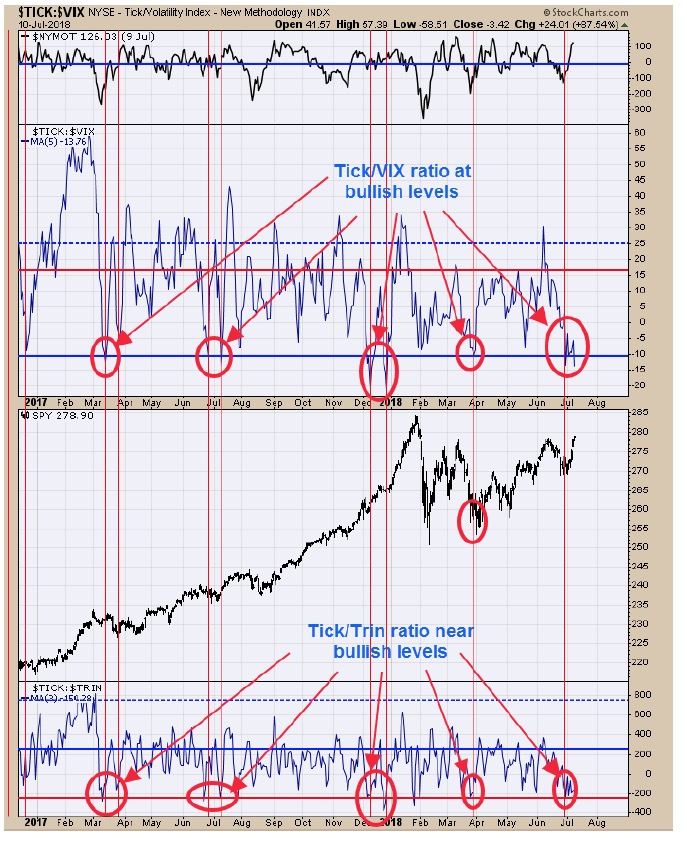 We have been experimenting with different tools creating ratios that may give insight on market movements. The bottom window is the 3 ma of the Tick/Trin ratio. Reading near -200 on this ratio have appeared near short term lows in the market. The window above the SPY graph is the 5 period Tick/VIX ratio. When this ratio is below minus 10 the market is in a bullish stance. SPX has resistance near the 2800 level (which is the February, March and June highs), and these indicators are not showing bearish signs, suggesting market can still move higher short term There are some gaps above that formed in late Janaury on the SPX near 2825 and 2850 ranges and may where market is heading. Long SPX on 6/29/18 at 2718.37.
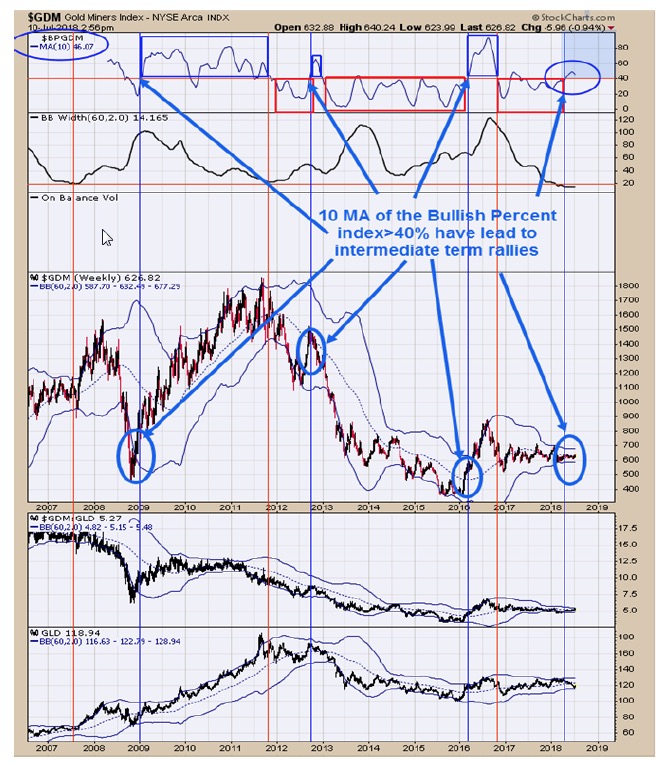
The above chart is the weekly Gold Miners index going back 12 years. The top window is the Bullish Percent index for the Gold Miners index with a 10 period moving average. Bullish signals have been triggered when the 10 period moving average of the Bullish Percent index closed above 40% (current reading is 46.07%). The closing above 40% bullish signal was triggered back in April about where the market is now. These weekly bullish percent index signals can last for months and longer. With the short term picture turning bullish for GDX, we are expecting the pinching of the Bollinger bands on the Gold Miners index start to widen, hopefully before July ends. Long GDX on 7/6/18 at 22.61.
Tim Ord,
Editor
Visit www.ord-oracle.com. New Book release "The Secret Science of Price and Volume" by Timothy Ord, buy on www.Amazon.com.